> ## Documentation Index
> Fetch the complete documentation index at: https://docs.chronosphere.io/llms.txt
> Use this file to discover all available pages before exploring further.
# Ingest Google Cloud metrics
[Google Cloud](https://cloud.google.com/products/operations?hl=en) integration
connects Chronosphere Observability Platform with Google Cloud to ingest metrics from
Google Cloud projects.
Observability Platform uses Google's
[service account impersonation](https://cloud.google.com/iam/docs/service-account-impersonation) as
the authentication mechanism to connect Google Cloud with Observability Platform.
Service account impersonation is trust-based, and uses short-lived credentials so
that one Google Cloud service account principal can impersonate another.
Use the [Google Cloud Integration Dashboard](/observe/dashboards/managed-dashboards#google-cloud-integration-gcp)
to review the status of your integration.
If you want to route log data from Google Cloud Platform, see
[Route logs from Google Cloud Platform](/ingest/logs/gcp-logs).
## Set up Google Cloud integration
Successful ingestion of Google Cloud metrics requires infrastructure changes for
your tenant, performed by Chronosphere, and changes to your Google Cloud, performed
by you.
You can perform your Google Cloud setup while Chronosphere works to provision your
tenant with the updated infrastructure.
1. Contact [Chronosphere Support](/support) to request infrastructure
changes to your tenant for Google Cloud integration.
Follow the remaining steps to set up your Google Cloud project. Metrics
won't flow into Chronosphere until infrastructure is provisioned for
your tenant.
2. Modify the Google Cloud domain restriction constraint.
If your Google Cloud organization restricts identities by
[domain](https://cloud.google.com/resource-manager/docs/organization-policy/restricting-domains),
you must add the Observability Platform customer identity (`C04aozwp9`) as an
allowed value in your policy.
3. Create a Google Cloud service account.
A Google Cloud service account isn't an Observability Platform service account.
Observability Platform requires a Google Cloud service account in the user's
Google Cloud project to provide Observability Platform access to metrics using
service account impersonation.
For each Google Cloud project,
[create a service account](https://cloud.google.com/iam/docs/service-accounts-create)
with the `monitoring.viewer` role.
To instead grant a more restricted set of permissions, implementing the principle
of least privilege, create a custom role with permissions for:
* `monitoring.timeSeries.list`
* `monitoring.metricDescriptors.list`
* `monitoring.metricDescriptors.get`
* `monitoring.monitoredResourceDescriptors.list`
* `monitoring.monitoredResourceDescriptors.get`
Chronosphere recommends [setting your project's quota](https://cloud.google.com/resource-manager/docs/creating-managing-projects#managing_project_quotas)
to twice your normal usage to protect against spikes and unexpected usage. Use the
[**GCP Timeseries API Quota Usage Per Project**](/observe/dashboards/managed-dashboards#gcp-timeseries-api-quota-usage-per-project)
dashboard to monitor project usage.
4. Add the Observability Platform principal to the Google Cloud service account.
Each Google Cloud service account must grant access to the Observability Platform
principal to impersonate them.
To retrieve your tenant-specific principal, click your [profile icon](/navigate#your-account) from the
menu bar and select **My Account**. Copy the value displayed next to **Google
Cloud Metrics IAM Principal**.
Grant the principal the `iam.serviceAccountTokenCreator` role.
5. Configure the integration in Observability Platform.
Initialize the integration using the
[Google Cloud integration API](/tooling/api-info/definition/operations/ListGcpMetricsIntegrations)
by applying the configuration with [Chronoctl](/tooling/chronoctl) or
[Terraform](/tooling/infrastructure/terraform).
For each Google Cloud project, supply the Google Cloud service account email
(`SERVICE-ACCOUNT@PROJECT-ID.iam.gserviceaccount.com`) in the request to configure
the integration, along with specific metrics to ingest using metric prefixes. See
[Metric Prefix Search](#metric-prefix-search) for examples.
### Example configuration
The following code provides an example for creating a single Google Cloud service
account in the user's Google Cloud project, and enables Observability Platform to
impersonate and gain access.
```terraform theme={null}
locals {
// Email address of Observability Platform tenant-specific principal.
chronosphere_sa_email = "SERVICE-ACCOUNT@PROJECT-ID.iam.gserviceaccount.com"
// Google Cloud project containing monitoring data to be ingested into
// Observability Platform.
monitoring_project_id = "PROJECT_ID"
}
// Service account that will allow Observability Platform tenant-specific principal
// to impersonate it.
resource "google_service_account" "chronosphere" {
project = local.monitoring_project_id
account_id = "chronosphere"
}
// Custom role with minimal set of permissions for principle of least privilege
// resource "google_project_iam_custom_role" "chronosphere" {
project = local.monitoring_project_id
role_id = "Google Cloud Integration Metrics Viewer"
title = "Google Cloud Integration Metrics Viewer"
description = "Role for granting view access for Google Cloud integration"
permissions = [
"monitoring.metricDescriptors.list",
"monitoring.timeSeries.list",
]
}
// The service account has the minimal set of permissions for access to the project
// containing the metric data so that it can retrieve time series data from the
// Google Cloud API.
resource "google_project_iam_member" "chronosphere" {
project = local.monitoring_project_id
role = google_project_iam_custom_role.chronosphere.id
member = google_service_account.chronosphere.member
}
// The service account provides the Observability Platform tenant-specific principal with
// roles/iam.serviceAccountTokenCreator access so that it can impersonate it. Only
// the Observability Platform tenant-specific principal will be able to perform this
// impersonation.
data "google_iam_policy" "chronosphere" {
binding {
role = "roles/iam.serviceAccountTokenCreator"
members = ["serviceAccount:${local.chronosphere_sa_email}"]
}
}
// Assign the token creator permission to the service account.
resource "google_service_account_iam_policy" "chronosphere" {
service_account_id = google_service_account.chronosphere.name
policy_data = data.google_iam_policy.chronosphere.policy_data
}
```
### Use metrics scopes for projects
Chronosphere encourages users to use
[metrics scoping for projects](https://cloud.google.com/monitoring/settings/multiple-projects)
in their Google Cloud environment, particularly for users that manage five or more
Google Cloud projects.
Chronosphere recommends creating a new metrics scoped project for use with metrics
ingestion. Using a new scoped project minimizes the impact on your existing workload.
Metrics scopes have benefits over configuring individual Google Cloud projects for
Google Cloud integration:
* Google Cloud API cost savings: With metrics scoping, Observability Platform ingests
metrics using the least number of API requests to Google Cloud. Metrics scoped
projects introduce a fan in/out model of ingesting metrics from the underlying
Google Cloud projects that will pack time series data points for each metric into
the smallest set of API responses. The Google Cloud API cost savings are
significant, particularly for users managing multiple Google Cloud projects.
* Configuration simplicity: With metrics scoping, users can manage a smaller set of
Google Cloud service accounts and configuration in Observability Platform. This
simplifies management of the Google Cloud integration.
## Set up Observability Platform to receive Google Cloud data
After configuring Google Cloud to enable Observability Platform to access metrics,
you must configure Observability Platform to receive and process those metrics.
### View Google Cloud integrations
To list or view Google Cloud integrations, use one of the following options:
To list your Google Cloud integrations:
```shell theme={null}
chronoctl gcp-metrics-integrations list
```
To view a Google Cloud integration with Chronoctl, use the command:
```shell theme={null}
chronoctl gcp-metrics-integrations read SLUG
```
Replace *`SLUG`* with the unique identifier of the Google Cloud integration.
To list Google Cloud integrations with the Chronosphere API, use the
[`ListGcpMetricsIntegrations`](/tooling/api-info/definition/operations/ListGcpMetricsIntegrations) endpoint.
To view a single Google Cloud integration with the Chronosphere API, use
the [`ReadGcpMetricsIntegration`](/tooling/api-info/definition/operations/ReadGcpMetricsIntegration)
endpoint.
Because the Chronosphere API requires authentication, include an API token with your
`curl` request, as shown in the following example. For more details, see
[Create an API token](/tooling/api-info#create-an-api-token).
```shell /"TOKEN"/ /INSTANCE/ /METHOD/ /ENDPOINT_PATH/ theme={null}
export CHRONOSPHERE_API_TOKEN="TOKEN"
export CHRONOSPHERE_DOMAIN="INSTANCE.chronosphere.io"
curl -H "API-Token: ${CHRONOSPHERE_API_TOKEN}" \
-X METHOD "https://${CHRONOSPHERE_DOMAIN}/ENDPOINT_PATH"
```
Replace the following:
* *`TOKEN`*: Your API token.
* *`INSTANCE`*: The subdomain name for your organization's Observability Platform instance.
* *`METHOD`*: The HTTP method to use with the request, such as `GET` or `POST`.
* *`ENDPOINT_PATH`*: The specific endpoint you want to access.
### Create or update a Google Cloud integration
You can create or update your Google Cloud integration with Observability Platform by
applying a configuration file with Chronoctl or Terraform. You must add your
service account to an Observability Platform team with
[SysAdmin](/administer/accounts-teams/teams#add-a-role-to-a-team) permissions.
To create a Google Cloud integration with Chronoctl, use the command:
```shell theme={null}
chronoctl gcp-metrics-integrations create --filename FILENAME
```
Replace *`FILENAME`* with the name of your Chronoctl configuration file.
To update a Google Cloud integration with Chronoctl, use the command:
```shell theme={null}
chronoctl gcp-metrics-integrations update --filename FILENAME
```
Replace *`FILENAME`* with the name of your Chronoctl configuration file.
The input file uses the following structure:
```yaml theme={null}
api_version: v1/config
kind: GcpMetricsIntegration
spec:
name: NAME
slug: SLUG
service_account:
client_email: EMAIL
metric_groups:
- project_id: PROJECT_ID
prefixes:
- PREFIX
```
To create a Google Cloud integration with Terraform, use the
`chronosphere_gcp_metrics_integration` resource:
```terraform theme={null}
resource "chronosphere_gcp_metrics_integration" "chronosphere_gcp_metrics" {
name = "GCP Metrics"
slug = "gcp-metrics"
service_account {
client_email = "metric-scoped-service-account@.iam.gserviceaccount.com" (
}
metric_groups {
project_id = "PROJECT_ID"
prefixes = [
"PREFIX",
]
}
```
To create Google Cloud integrations with the Observability Platform API, use the
[`CreateGcpMetricsIntegration`](/tooling/api-info/definition/operations/CreateGcpMetricsIntegration)
endpoint.
To update a single Google Cloud integration with the Observability Platform API, use
the [`UpdateGcpMetricsIntegration`](/tooling/api-info/definition/operations/UpdateGcpMetricsIntegration)
endpoint.
Because the Chronosphere API requires authentication, include an API token with your
`curl` request, as shown in the following example. For more details, see
[Create an API token](/tooling/api-info#create-an-api-token).
```shell /"TOKEN"/ /INSTANCE/ /METHOD/ /ENDPOINT_PATH/ theme={null}
export CHRONOSPHERE_API_TOKEN="TOKEN"
export CHRONOSPHERE_DOMAIN="INSTANCE.chronosphere.io"
curl -H "API-Token: ${CHRONOSPHERE_API_TOKEN}" \
-X METHOD "https://${CHRONOSPHERE_DOMAIN}/ENDPOINT_PATH"
```
Replace the following:
* *`TOKEN`*: Your API token.
* *`INSTANCE`*: The subdomain name for your organization's Observability Platform instance.
* *`METHOD`*: The HTTP method to use with the request, such as `GET` or `POST`.
* *`ENDPOINT_PATH`*: The specific endpoint you want to access.
Replace the following:
* *`NAME`*: (string) The name of the Google Cloud integration.
* *`SLUG`*: (string) The unique identifier of the Google Cloud integration.
* *`EMAIL`*: (string) The email address of the customer's
Google Cloud service account of the form
`SERVICE_ACCOUNT@PROJECT-ID.iam.gserviceaccount.com`.
* *`PROJECT_ID`*: (string) The ID of the customer's Google Cloud project
to ingest metrics from.
* *`PREFIX`*: (list(string)) A list of
[metric prefixes](#metric-prefix-search) to ingest from the Google Cloud project.
#### Control incoming metrics
Google Cloud charges users for metrics leaving their system, potentially incurring
costs for scraped metrics that aren't needed. During ingestion into
Observability Platform, users can apply [rollup](/control/shaping/shape-metrics/rules/rollup) and
[drop](/control/shaping/shape-metrics/rules/drop-rules) rules to reduce ingestion and storage
costs, but these apply after extraction from Google Cloud.
To reduce the number of metrics extracted from Google Cloud, Observability Platform
provides the following configuration options:
* *Filters*: [Filters in Google Cloud](https://docs.cloud.google.com/monitoring/api/v3/filters)
let you target a subset of metrics. Filters don't replace
[prefixes](/ingest/metrics-traces/gcp#metric-prefix-search). Instead, filters
apply to metric and resource labels, or other user-defined metadata.
Due to constraints in the Google Cloud monitoring API, when filtering by
user-defined metadata, the resulting metric type changes to `DELTA` in the case
of a `CUMULATIVE` metric. Metric query expressions might need adjustment to use
delta-specific query functions (for example, `sum_over_second`).
* *Rollup Rules*: Rollup rules enable pre-aggregation of a metric by specifying which result
dimensions should be returned. All other labels will be dropped. Use these rules to
[reduce cardinality](/control/shaping/shape-metrics/reduce-cardinality) of returned time series
from Google Cloud by dropping dimensions that aren't needed.
Exclude all metrics where the `metadata.system_labels` "region" label matches
`us-central1-a`:
```yaml theme={null}
metric_groups:
- project_id: PROJECT_ID
prefixes:
- PREFIX
filters:
- name: "region"
value_glob: "!us-central1-a"
scope: "METADATA_SYSTEM_LABELS"
```
Selectively aggregate a subset of metrics for non-production environments, using
a `metadata.user_labels` label of `cluster`.
```yaml theme={null}
metric_groups:
- project_id: PROJECT_ID
prefixes:
- PREFIX
filters:
- name: cluster
value_glob: prod-*
scope: "METADATA_USER_LABELS"
- project_id: PROJECT_ID
prefixes:
- PREFIX
filters:
- name: cluster
value_glob: rnd-*
scope: "METADATA_USER_LABELS"
rollup_rules:
- metric_name: METRIC_NAME
label_policy:
keep:
- name: cluster
scope: "METADATA_USER_LABELS"
```
### Delete a Google Cloud integration
Delete a Google Cloud integration using one of the following methods:
To delete a Google Cloud integration with Chronoctl, your account must have
[SysAdmin](/administer/accounts-teams/teams#add-a-role-to-a-team) permissions.
Use the command:
```shell theme={null}
chronoctl gcp-metrics-integrations delete SLUG
```
To complete this action with the Chronosphere API, use the
[`DeleteGcpMetricsIntegration`](/tooling/api-info/definition/operations/DeleteGcpMetricsIntegration)
endpoint.
Because the Chronosphere API requires authentication, include an API token with your
`curl` request, as shown in the following example. For more details, see
[Create an API token](/tooling/api-info#create-an-api-token).
```shell /"TOKEN"/ /INSTANCE/ /METHOD/ /ENDPOINT_PATH/ theme={null}
export CHRONOSPHERE_API_TOKEN="TOKEN"
export CHRONOSPHERE_DOMAIN="INSTANCE.chronosphere.io"
curl -H "API-Token: ${CHRONOSPHERE_API_TOKEN}" \
-X METHOD "https://${CHRONOSPHERE_DOMAIN}/ENDPOINT_PATH"
```
Replace the following:
* *`TOKEN`*: Your API token.
* *`INSTANCE`*: The subdomain name for your organization's Observability Platform instance.
* *`METHOD`*: The HTTP method to use with the request, such as `GET` or `POST`.
* *`ENDPOINT_PATH`*: The specific endpoint you want to access.
## Metric information
The following sections contain information about Google Cloud metrics information and
how Observability Platform uses or displays it.
### Metrics availability
Google metrics have different [stages of availability](https://cloud.google.com/document-ai/docs/reference/rest/Shared.Types/LaunchStage).
Observability Platform prioritizes metrics Google considers Generally Available (GA).
Non-GA metrics ingest based on a best-effort basis, and might not provide stable
data.
On average, Google Cloud metrics display in Observability Platform with a delay on
the order of minutes from the metric timestamp in Google Cloud. These metrics appear
delayed due to the following factors:
* Latency delay: Most Google Cloud metrics have a
[delay](https://cloud.google.com/monitoring/api/metrics#metadata) before they're
made available for querying by Google Cloud API.
Metrics with an ingest delay exceeding seven hours won't be ingested into
Chronosphere. For example, Firebase database metrics can exceed this latency delay
and won't be ingested.
* Sample rate: Google Cloud metrics
[sample](https://cloud.google.com/monitoring/api/metrics#metadata) at different
rates. Most metrics sample at 60-second intervals, with some as long as once
per day.
Due to these delays, configure monitors to expect a delay in arrival. Use the PromQL
[offset modifier](https://prometheus.io/docs/prometheus/latest/querying/basics/#offset-modifier)
to account for delays.
Observability Platform doesn't ingest the following networking flow metric prefixes
due to their unpredictable data volumes and cardinality. If you have a specific need
for metrics using these prefixes, contact [Chronosphere Support](/support).
* `networking.googleapis.com/pod_flow`
* `networking.googleapis.com/vm_flow`
* `networking.googleapis.com/node_flow`
### Metric names
In Observability Platform,
[Google Cloud metrics](https://cloud.google.com/monitoring/api/metrics) have
the following name structure:
```text theme={null}
gcp__
```
where:
* `MONITORED-RESOURCE-NAME` is the
[monitored resource type](https://cloud.google.com/monitoring/api/resources#tag_gce_disk) in
Google Cloud.
* `FULLY-QUALIFIED-METRIC-NAME` is the metric name in Google Cloud, with characters like `.`
and `/` convert to `_` to be
[Prometheus compatible](/ingest/metrics-traces/collector/mappings/prometheus/prometheus-recommendations).
The following examples are fully qualified metric names in Google Cloud before metric name sanitization:
* `bigquery.googleapis.com/job/num_in_flight`
* `cloudsql.googleapis.com/database/available_for_failover`
* `kubernetes.io/container/accelerator/memory_total`
The following is an example of how to map a CloudSQL metric name in Google Cloud to a
metric name in Observability Platform:
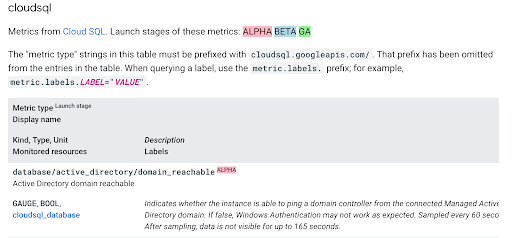 For this metric, `cloudsql_database` is the monitored resource name and
`cloudsql.googleapis.com/database/active_directory/domain_reachable` is the fully
qualified metric name. In Observability Platform, the metric name is
`gcp_cloudsql_database_cloudsql_googleapis_com_database_active_directory_domain_reachable`.
### Metric labels
You can request custom labels for your Google Cloud metrics as `defaultLabels`. Contact
[Chronosphere Support](/support) to add them.
When importing metrics, some `defaultLabels` may conflict with prefixes which
already exist in Observability Platform (for example, `job`). When this occurs,
Observability Platform adds the prefix `exported_` to the source labels to prevent
conflicts.
### Finding Google Cloud metrics in Metrics Explorer
Use [Metrics Explorer](/investigate/querying/metrics/explorer) to find and review the status
of your ingested metrics.
* All Google Cloud metrics start with the prefix `gcp_`. Searching for this prefix
displays all Google Cloud metrics in the platform.
* Substring search is possible. For example, if the original Google Cloud metric name
contains a substring like `domain_reachable`, searching for the substring returns
the Google Cloud metric, along with other metrics containing the substring.
### Metric mappings
Google Cloud metrics map closely to Observability Platform metric types. Metric
mappings are defined on the [metric types](/control/shaping/shape-metrics/types#google-cloud) page.
### Metric prefix search
Google Cloud integration scrapes metrics by metric prefix search using the
[Monitoring Query Language (MQL)](https://cloud.google.com/monitoring/custom-metrics/reading-metrics).
Metrics prefix searches use an implicit wildcard (`*`), and don't require wildcards
in the configuration to search for multiple metrics.
This following table provides configuration examples for Google Cloud integration:
| Metric Prefix | Description | Example Metrics |
| ------------------------------------- | ------------------------------------------------------- | ---------------------------------------------------------------------------------------------------------------------------------------------------------------------------------------------------------------------------------------------- |
| `cloudsql.googleapis.com/` | Ingest all CloudSQL metrics | `cloudsql.googleapis.com/database/active_directory/domain_reachable` `cloudsql.googleapis.com/database/active_directory/instance_available` `cloudsql.googleapis.com/database/data_cache/bytes_used` `cloudsql.googleapis.com/database/uptime` |
| `cloudsql.googleapis.com/database/` | Ingest all CloudSQL metrics starting with `database/` | `cloudsql.googleapis.com/database/active_directory/domain_reachable` `cloudsql.googleapis.com/database/active_directory/instance_available` `cloudsql.googleapis.com/database/data_cache/bytes_used` `cloudsql.googleapis.com/database/uptime` |
| `bigquery.googleapis.com/s` | Ingest all BigQuery metrics starting with `s` | `bigquery.googleapis.com/slots/allocated` `bigquery.googleapis.com/slots/allocated_for_reservation` `bigquery.googleapis.com/storage/insertall_inserted_rows` `bigquery.googleapis.com/storage/uploaded_row_count` |
| `cloudsql.googleapis.com/database/up` | Ingest all CloudSQL metrics starting with `database/up` | `cloudsql.googleapis.com/database/up` `cloudsql.googleapis.com/database/uptime` |
| `b` | Ingest all metrics starting with `b` | `backupdr.googleapis.com/protected_data/volume` `bigquery.googleapis.com/slots/allocated` `bigtable.googleapis.com/backup/bytes_used` |
For this metric, `cloudsql_database` is the monitored resource name and
`cloudsql.googleapis.com/database/active_directory/domain_reachable` is the fully
qualified metric name. In Observability Platform, the metric name is
`gcp_cloudsql_database_cloudsql_googleapis_com_database_active_directory_domain_reachable`.
### Metric labels
You can request custom labels for your Google Cloud metrics as `defaultLabels`. Contact
[Chronosphere Support](/support) to add them.
When importing metrics, some `defaultLabels` may conflict with prefixes which
already exist in Observability Platform (for example, `job`). When this occurs,
Observability Platform adds the prefix `exported_` to the source labels to prevent
conflicts.
### Finding Google Cloud metrics in Metrics Explorer
Use [Metrics Explorer](/investigate/querying/metrics/explorer) to find and review the status
of your ingested metrics.
* All Google Cloud metrics start with the prefix `gcp_`. Searching for this prefix
displays all Google Cloud metrics in the platform.
* Substring search is possible. For example, if the original Google Cloud metric name
contains a substring like `domain_reachable`, searching for the substring returns
the Google Cloud metric, along with other metrics containing the substring.
### Metric mappings
Google Cloud metrics map closely to Observability Platform metric types. Metric
mappings are defined on the [metric types](/control/shaping/shape-metrics/types#google-cloud) page.
### Metric prefix search
Google Cloud integration scrapes metrics by metric prefix search using the
[Monitoring Query Language (MQL)](https://cloud.google.com/monitoring/custom-metrics/reading-metrics).
Metrics prefix searches use an implicit wildcard (`*`), and don't require wildcards
in the configuration to search for multiple metrics.
This following table provides configuration examples for Google Cloud integration:
| Metric Prefix | Description | Example Metrics |
| ------------------------------------- | ------------------------------------------------------- | ---------------------------------------------------------------------------------------------------------------------------------------------------------------------------------------------------------------------------------------------- |
| `cloudsql.googleapis.com/` | Ingest all CloudSQL metrics | `cloudsql.googleapis.com/database/active_directory/domain_reachable` `cloudsql.googleapis.com/database/active_directory/instance_available` `cloudsql.googleapis.com/database/data_cache/bytes_used` `cloudsql.googleapis.com/database/uptime` |
| `cloudsql.googleapis.com/database/` | Ingest all CloudSQL metrics starting with `database/` | `cloudsql.googleapis.com/database/active_directory/domain_reachable` `cloudsql.googleapis.com/database/active_directory/instance_available` `cloudsql.googleapis.com/database/data_cache/bytes_used` `cloudsql.googleapis.com/database/uptime` |
| `bigquery.googleapis.com/s` | Ingest all BigQuery metrics starting with `s` | `bigquery.googleapis.com/slots/allocated` `bigquery.googleapis.com/slots/allocated_for_reservation` `bigquery.googleapis.com/storage/insertall_inserted_rows` `bigquery.googleapis.com/storage/uploaded_row_count` |
| `cloudsql.googleapis.com/database/up` | Ingest all CloudSQL metrics starting with `database/up` | `cloudsql.googleapis.com/database/up` `cloudsql.googleapis.com/database/uptime` |
| `b` | Ingest all metrics starting with `b` | `backupdr.googleapis.com/protected_data/volume` `bigquery.googleapis.com/slots/allocated` `bigtable.googleapis.com/backup/bytes_used` |