> ## Documentation Index
> Fetch the complete documentation index at: https://docs.chronosphere.io/llms.txt
> Use this file to discover all available pages before exploring further.
# Create queries with the Query Builder
Creating queries to find and analyze data from scratch can take time. To help with
the task, Chronosphere includes a tool you can use to construct, optimize, and
debug queries before saving and using them, and sharing them with your team.
To open the tool, click **Edit in Query Builder** when working on a query in Chronosphere,
which displays the **Query Builder** pane with the contents of the query you're working
on. Any changes you make in the tool are reflected back to your original query after
you click **Done**.
The interface has two main sections, the expression and results sections.
Click **Cancel** to close the tool without saving, **Done** to save and close,
and **Expand Query Builder** to toggle
full-screen mode.
 ## Expression section
The expression section contains the main query box for constructing your query, and
the combined analysis and builder.
As you enter content in the query box, the Query Builder automatically completes
metric names, label names, label values, function names, operators, and modifiers as
you type. After you construct a query expression, press `Enter`
(`Return` on macOS) to submit it. To clear the query box,
click **Remove query** at the end of the query box.
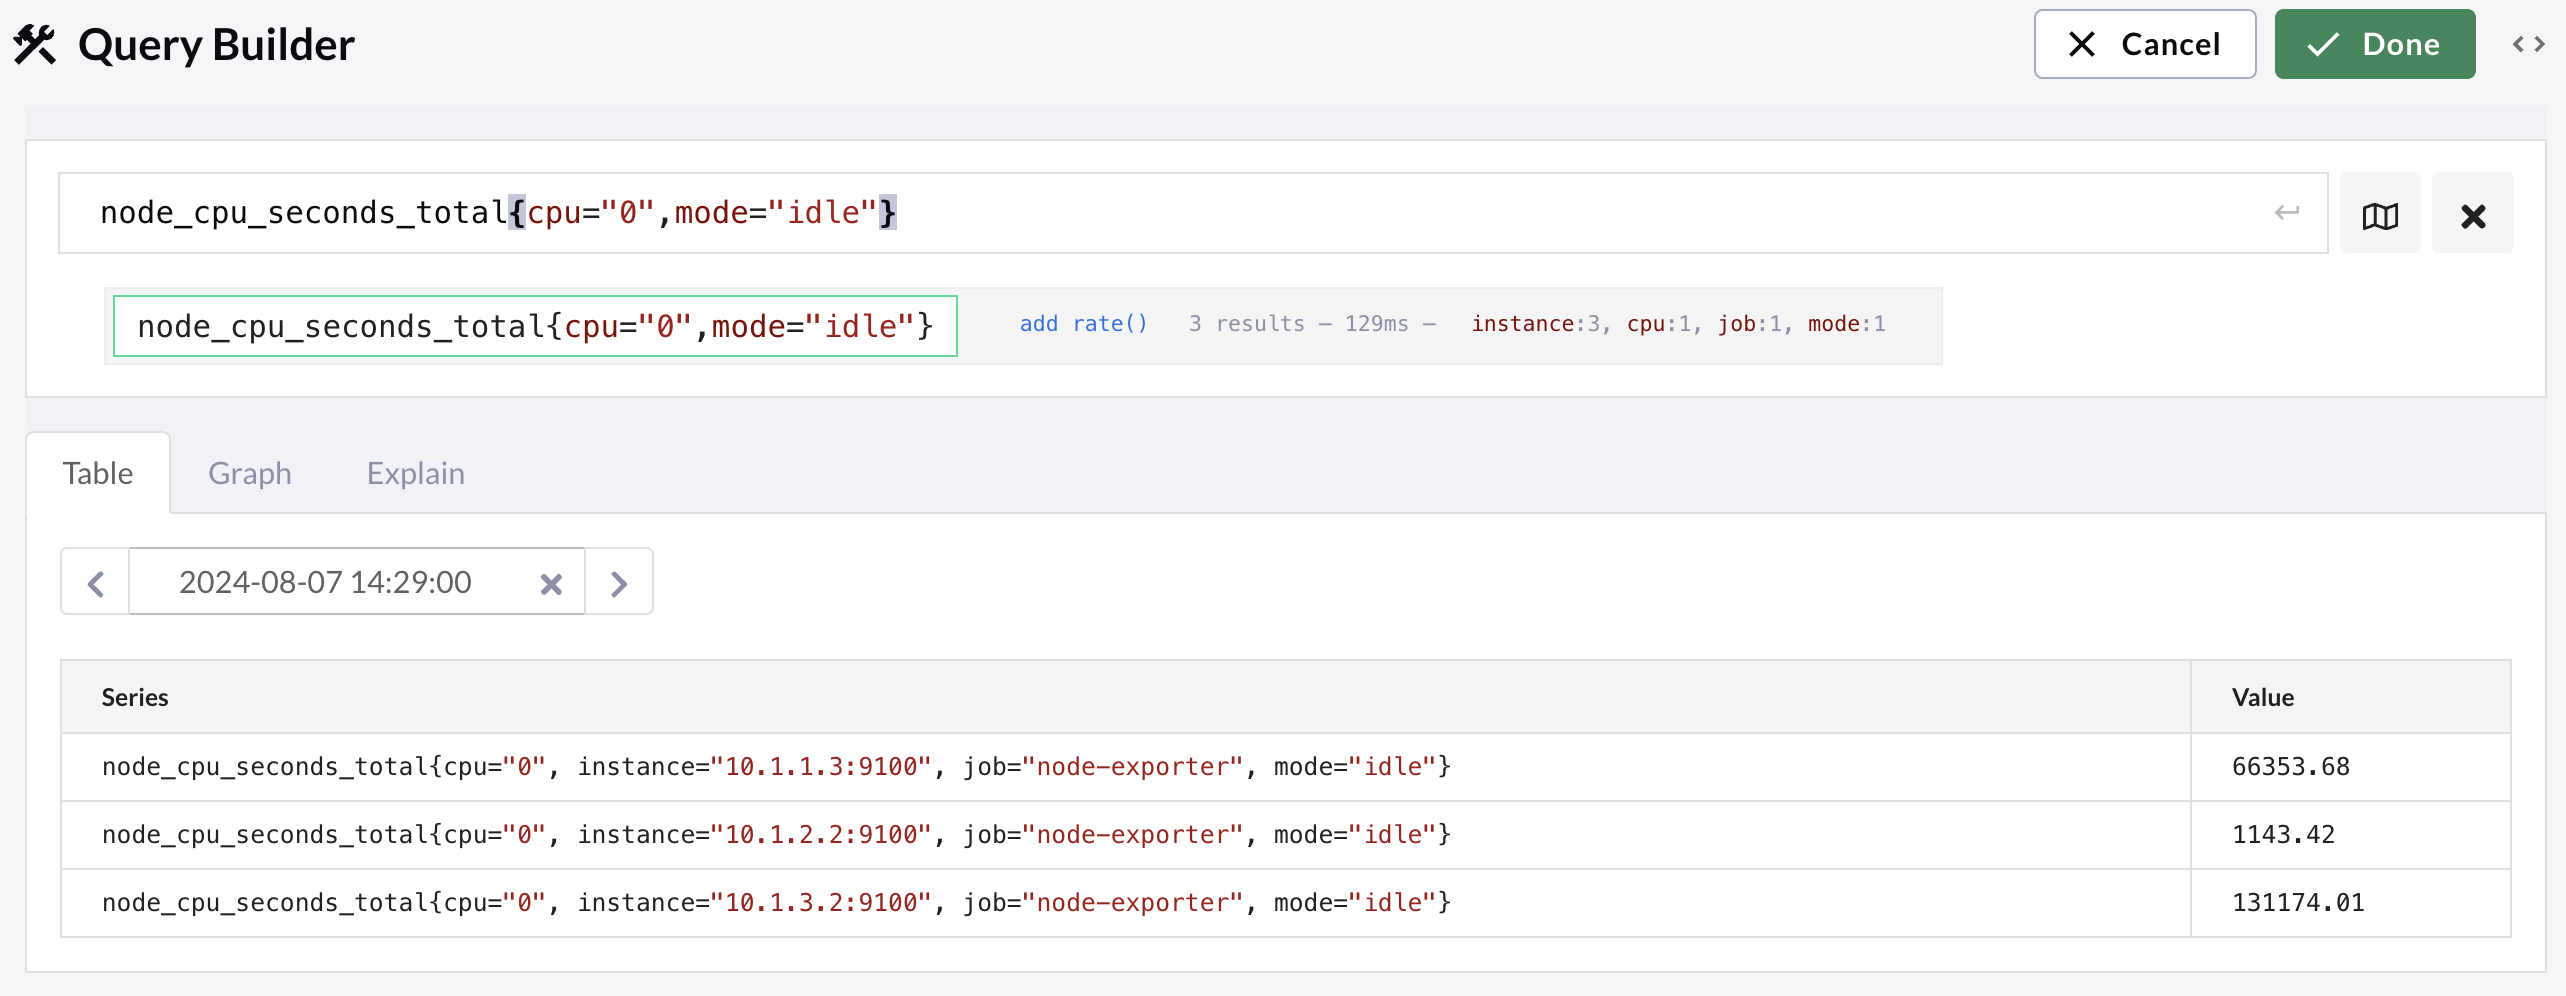
The area following the expression field displays details of each part of the query
as a cascading tree. Each part provides an analysis of the results, including the
quantity, the time taken to fetch them, the labels, and the number of unique values
of each label. Hold the pointer over a value to display a summary of all values.
If the Query Builder has a recommendation for optimizing the query with a relevant
PromQL operator or function, the recommendation is displayed to the right of the
item. Click the suggestion to apply it to the existing query or hold the pointer
over the suggestion for an explanation.
If the original query consists of different types of parts (for example a function,
offset, and query), click the small **+** icon to expand each part for a greater
breakdown of the query. If the query consists of a subquery, click each of the queries
to run it separately, and again for more breakdown and analysis.
If you hold the pointer over the text of any query part, you can edit each part as
**PromQL** or as a **Form** step.
### PromQL mode
Adding and editing parts in PromQL mode is similar to the overall expression
field, offering autocompletion for metric names, label names, label values, function
names, operators, and modifiers as you type. Press `Enter` to submit any updates
to the query.
### Form mode
If you're new to PromQL you can toggle creating a query between PromQL and Form mode.
Form mode lets you define a query using a form-type interface, combining different
components to build complex and nested expressions. As you step through the components,
you're prompted for other components to add as parameters. Add them by clicking the
prompt, and then click **Apply changes** for each child component and finally the parent
component.
The components for the form vary depending on the type of expression you want to
construct.
* **Select data**: Return a set of time series and values based on the criteria
supplied. Use this component to return an instant or range of values, an offset
value, or a timestamp range.
* **Aggregate over labels**: Take a range of values and generate a single
significant value. You can also use this component to either keep or exclude the
labels you specify.
* **Binary operation**: Perform a
[binary operation](https://prometheus.io/docs/prometheus/latest/querying/operators/#binary-operators)
or comparison between two values.
* **Call function**: Apply [PromQL functions](https://prometheus.io/docs/prometheus/latest/querying/functions/)
to a vector of time series.
* **Literal value**: Add a literal string or integer value into an expression.
* **Subquery**: Add another query to an expression.
* **Parenthesis**: Add parenthesis to an expression.
* **Unary expression**: Use unary operators between components.
## Results section
The results section provides information about the query you entered, based on these
tabs:
* **Table**: A list of the first 1,000 unique series and any associated values.
* **Graph**: A series based on the selected query item that's plotted on a stacked or
unstacked graph. You can change both the time range the graph focuses on, and the
resolution.
* **Explain**: Additional information about the selected node in the Query Builder,
and guidance (if available).
## Expression section
The expression section contains the main query box for constructing your query, and
the combined analysis and builder.
As you enter content in the query box, the Query Builder automatically completes
metric names, label names, label values, function names, operators, and modifiers as
you type. After you construct a query expression, press `Enter`
(`Return` on macOS) to submit it. To clear the query box,
click **Remove query** at the end of the query box.
The area following the expression field displays details of each part of the query
as a cascading tree. Each part provides an analysis of the results, including the
quantity, the time taken to fetch them, the labels, and the number of unique values
of each label. Hold the pointer over a value to display a summary of all values.
If the Query Builder has a recommendation for optimizing the query with a relevant
PromQL operator or function, the recommendation is displayed to the right of the
item. Click the suggestion to apply it to the existing query or hold the pointer
over the suggestion for an explanation.
If the original query consists of different types of parts (for example a function,
offset, and query), click the small **+** icon to expand each part for a greater
breakdown of the query. If the query consists of a subquery, click each of the queries
to run it separately, and again for more breakdown and analysis.
If you hold the pointer over the text of any query part, you can edit each part as
**PromQL** or as a **Form** step.
### PromQL mode
Adding and editing parts in PromQL mode is similar to the overall expression
field, offering autocompletion for metric names, label names, label values, function
names, operators, and modifiers as you type. Press `Enter` to submit any updates
to the query.
### Form mode
If you're new to PromQL you can toggle creating a query between PromQL and Form mode.
Form mode lets you define a query using a form-type interface, combining different
components to build complex and nested expressions. As you step through the components,
you're prompted for other components to add as parameters. Add them by clicking the
prompt, and then click **Apply changes** for each child component and finally the parent
component.
The components for the form vary depending on the type of expression you want to
construct.
* **Select data**: Return a set of time series and values based on the criteria
supplied. Use this component to return an instant or range of values, an offset
value, or a timestamp range.
* **Aggregate over labels**: Take a range of values and generate a single
significant value. You can also use this component to either keep or exclude the
labels you specify.
* **Binary operation**: Perform a
[binary operation](https://prometheus.io/docs/prometheus/latest/querying/operators/#binary-operators)
or comparison between two values.
* **Call function**: Apply [PromQL functions](https://prometheus.io/docs/prometheus/latest/querying/functions/)
to a vector of time series.
* **Literal value**: Add a literal string or integer value into an expression.
* **Subquery**: Add another query to an expression.
* **Parenthesis**: Add parenthesis to an expression.
* **Unary expression**: Use unary operators between components.
## Results section
The results section provides information about the query you entered, based on these
tabs:
* **Table**: A list of the first 1,000 unique series and any associated values.
* **Graph**: A series based on the selected query item that's plotted on a stacked or
unstacked graph. You can change both the time range the graph focuses on, and the
resolution.
* **Explain**: Additional information about the selected node in the Query Builder,
and guidance (if available).