> ## Documentation Index
> Fetch the complete documentation index at: https://docs.chronosphere.io/llms.txt
> Use this file to discover all available pages before exploring further.
# Classic Metrics Explorer
export const AddToDashboardIcon = props => {
return ;
};
The classic Metrics Explorer is an older tool for investigating query requests and
responses, and for crafting queries of your metrics.
Classic Metrics Explorer does not receive feature updates. Moving to
[Metrics Explorer](/investigate/querying/metrics/explorer) is recommended.
## Open classic Metrics Explorer
To open the classic Metrics Explorer:
1. In the navigation menu, click
** Explorers > Metrics Explorer**.
2. If the **Metrics Explorer** in your navigation menu opens the new
[Observability Platform Metrics Explorer](/investigate/querying/metrics/explorer)
interface, you can access the classic Metrics Explorer by clicking the
** three vertical dots > Revert to classic Metrics Explorer**
in the Observability Platform Metrics Explorer's configuration bar.
3. A dialog opens to confirm or cancel your decision. To always open the classic
Metrics Explorer when you select the navigation menu's Metrics Explorer item,
enable the **Always default to classic** checkbox in this dialog, then click
**Revert**.
### Switch to new Metrics Explorer
The
[new Metrics Explorer](/investigate/querying/metrics/explorer) is a completely rewritten
version of the Metrics Explorer that's fully integrated with the rest of
Observability Platform.
The classic Metrics Explorer is no longer being developed. Chronosphere implements
all new functionality and improvements only in the new Metrics Explorer.
To change all Metrics Explorer links in Observability Platform to open the new Metrics Explorer
instead of the classic Metrics Explorer:
1. Click
** Switch to new Metrics Explorer**.
2. Click **Enable**.
## Metrics sources
The classic Metrics Explorer defaults to Prometheus metrics. To switch your metrics source,
select an option from the dropdown next to **Explore**. For example, if you're
ingesting Graphite metrics, switch the data source to **Chronosphere Graphite**. The
display changes slightly depending on your source.
## Query field
The Query field supports autocomplete for metric names and functions. Click an
autocomplete result to update a query with a suggestion. To execute a query, press
`Shift+Enter` (`Shift+Return` on macOS).
The query field makes suggestions regarding how to improve a query based on these
factors:
* For counters (monotonically increasing metrics), a rate function is suggested.
* For buckets, a histogram function is suggested.
Chronosphere Observability Platform provides
[internal metrics](#available-metrics-for-troubleshooting) for troubleshooting
queries.
When typing in the query field with a label filter, some special characters such as a
plus sign ( `+` ) or open parenthesis ( `(` ) might cause
Observability Platform to display an error message, like:
```text theme={null}
An unexpected error happened
DetailsSyntaxError: Invalid regular expression:
```
To work around this issue, use the dropdown to select a value, or copy and paste
the value from another location.
To run an additional query, click ** Add query**.
Click ** Remove query** to remove a secondary query, or
click **Clear all** to remove all query conditions.
### Explore metrics
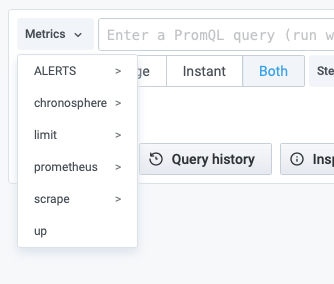
For Prometheus metrics, on the left side of the query field, the **Metrics** menu
opens the classic Metrics Explorer that shows a hierarchical menu with metrics grouped
by their prefix. This is a good starting point if you want to explore which metrics
are available.
Selecting metrics from the **Metrics** menu adds them to the **Query field**.
Click **Edit in Query Builder** to open queries in the Query Builder.
Observability Platform includes a Query Builder you can use to construct, optimize,
and debug queries before saving and using them, and for sharing queries with your
team.
For details, see [Query Builder](/investigate/querying/metrics/builder).
For Graphite, click the text box next to **Series** and select a metric. To add
functions, click the **+** next to **Functions** and edit the selected function to
include your values.
### Query type
To update the type of query, select from the following options:
* **Range**
* **Instant**
* **Both**
Add a **Step** size in the text field to change the query step size.
## Split and compare queries
The split view provides a way to compare queries and their graphs and tables
side-by-side or to review related data together on one page.
To open the split view, click **Split** to duplicate the current query and split the
page into two side-by-side queries.
In split view, you can link the time pickers for both
panels by clicking one of the time-sync buttons attached to the time pickers.
To close the newly created query, click **Close Split**.
## Share queries
Complicated queries can generate long URLs that are difficult to share effectively.
Click **Copy URL** to copy a short URL to your
clipboard you can share with other users. When a query matches a query that was
previously shortened, the existing short URL is reused.
Observability Platform permanently stores short URLs in your tenant so that they
don't expire.
## Query history
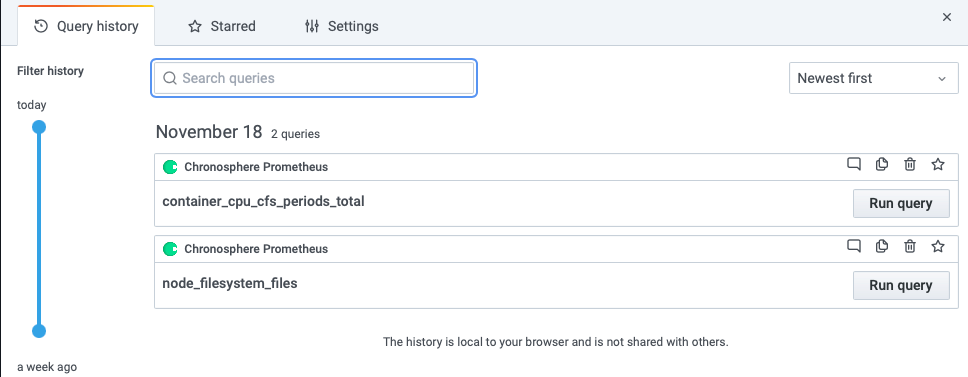
Click **Query history** for a list of queries that you have used in Explore local
to your browser.
For each individual query, you can:
* Click **Run query** to re-run a query.
* Click the text bubble to create or edit a comment.
* Copy a query to the clipboard.
* Click the trash can to remove a query from the list.
* Click the **Star** to save a query. Starred queries show in the **Starred** tab.
By default, query history shows the most recent queries. You can change this from
the **Sort queries by** dropdown menu. The menu defaults to `Newest first`.
Search previous queries using the search box at the top of the list.
Use the slider to the left of the query list to filter queries over time.
### Query history settings
You can change the following settings for query history from the **Settings** tab:
* The period of time to save query history (default: 1 week)
* The default active tab (default: Query history tab)
* Only show queries for active data source (default: true)
* Clear query history
## Inspector
The **Inspector** helps you understand and troubleshoot queries. Available options
are:
* An overview of **Stats** for the query, including:
* **Total request time**
* **Data processing time**
* **Number of queries**
* **Total number rows**
* The **Query inspector**, which lets you to inspect the raw data.
* The **JSON** tab, to export the query as JSON.
* The **Data** tab, which shows raw data. Click **Download CSV** to export the data
to as a comma-separated values (CSV) file.
## Available metrics for troubleshooting
Additional metrics in your environment track the overall health of alerting and
recording rules that you've configured. The following examples are based on
Prometheus queries and troubleshooting.
Each metric has multiple labels you can use for slicing and monitoring, in the
following format:
* `metric_name`: metric\_description
* `label_name`: label\_description + use
Visit [Prometheus metric naming recommendations](/ingest/metrics-traces/collector/mappings/prometheus/prometheus-recommendations) for more
details about naming metrics.
Observability Platform provides the following metrics for troubleshooting:
* `prometheus_rule_group_last_duration_seconds`: A gauge metric that holds the total
time the group took to complete its last iteration, in seconds.
* `rule_group`: The group that this rule belongs to.
* `prometheus_rule_evaluation_duration_seconds`: A summary metric to track the
average time an individual rule takes to evaluate.
* `prometheus_rule_evaluations_total`: The total number of individual rule
evaluations that occur.
* `rule_group`: The group that this rule belongs to.
* `prometheus_rule_group_iterations_missed_total`: The total number of rule group
evaluations missed due to slow rule group evaluation.
* `rule_group`: The group that this rule belongs to.
* `prometheus_rule_group_iterations_total`: The total number of scheduled rule group
evaluations, whether executed or missed.
* `rule_group`: The group that this rule belongs to.
* `prometheus_rule_eval_failures_total`: The total number of individual rule
evaluation failures.
* `rule_group`: The group that this rule belongs to.
* `type`: Alerting or recording depending on the type of rule.
* `identifier`: The slug for the given rule.
* `status_code`: The status code associated with the given evaluation failure.
### Examples
The following examples explain how to create alerts for particular situations:
* Consistent rule failures
To receive an alert whenever an individual rule consistently fails for five
minutes, [create a monitor](/investigate/alerts/monitors#create-a-monitor)
with the following query:
```text theme={null}
sum by (identifier) (rate(prometheus_rule_eval_failures_total[1m]))
```
with a **Sustain** of 5m.
You can also create an alert for monitoring individual rule failures:
```text theme={null}
sum by (identifier) (rate(prometheus_rule_eval_failures_total{type=""}[1m])
```
* Create alerts by rule type
If you want to alert on certain types of rules, you can do something like:
```text theme={null}
sum by (identifier) (rate(prometheus_rule_eval_failures_total{identifier=~""}[1m]))
```
For example, to create an alert only for a specific category of rules, you can do
something like:
```text theme={null}
sum by (identifier) (rate(prometheus_rule_eval_failures_total{type=""}[1m])
```
 Selecting metrics from the **Metrics** menu adds them to the **Query field**.
Click **Edit in Query Builder** to open queries in the Query Builder.
Selecting metrics from the **Metrics** menu adds them to the **Query field**.
Click **Edit in Query Builder** to open queries in the Query Builder.
 In split view, you can link the
  For each individual query, you can:
* Click **Run query** to re-run a query.
* Click the text bubble to create or edit a comment.
* Copy a query to the clipboard.
* Click the trash can to remove a query from the list.
* Click the **Star** to save a query. Starred queries show in the **Starred** tab.
By default, query history shows the most recent queries. You can change this from
the **Sort queries by** dropdown menu. The menu defaults to `Newest first`.
Search previous queries using the search box at the top of the list.
Use the slider to the left of the query list to filter queries over time.
### Query history settings
You can change the following settings for query history from the **Settings** tab:
* The period of time to save query history (default: 1 week)
* The default active tab (default: Query history tab)
* Only show queries for active data source (default: true)
* Clear query history
## Inspector
The **Inspector** helps you understand and troubleshoot queries. Available options
are:
* An overview of **Stats** for the query, including:
* **Total request time**
* **Data processing time**
* **Number of queries**
* **Total number rows**
* The **Query inspector**, which lets you to inspect the raw data.
* The **JSON** tab, to export the query as JSON.
* The **Data** tab, which shows raw data. Click **Download CSV** to export the data
to as a comma-separated values (CSV) file.
## Available metrics for troubleshooting
Additional metrics in your environment track the overall health of alerting and
recording rules that you've configured. The following examples are based on
Prometheus queries and troubleshooting.
Each metric has multiple labels you can use for slicing and monitoring, in the
following format:
* `metric_name`: metric\_description
* `label_name`: label\_description + use
Visit [Prometheus metric naming recommendations](/ingest/metrics-traces/collector/mappings/prometheus/prometheus-recommendations) for more
details about naming metrics.
Observability Platform provides the following metrics for troubleshooting:
* `prometheus_rule_group_last_duration_seconds`: A gauge metric that holds the total
time the group took to complete its last iteration, in seconds.
* `rule_group`: The group that this rule belongs to.
* `prometheus_rule_evaluation_duration_seconds`: A summary metric to track the
average time an individual rule takes to evaluate.
* `prometheus_rule_evaluations_total`: The total number of individual rule
evaluations that occur.
* `rule_group`: The group that this rule belongs to.
* `prometheus_rule_group_iterations_missed_total`: The total number of rule group
evaluations missed due to slow rule group evaluation.
* `rule_group`: The group that this rule belongs to.
* `prometheus_rule_group_iterations_total`: The total number of scheduled rule group
evaluations, whether executed or missed.
* `rule_group`: The group that this rule belongs to.
* `prometheus_rule_eval_failures_total`: The total number of individual rule
evaluation failures.
* `rule_group`: The group that this rule belongs to.
* `type`: Alerting or recording depending on the type of rule.
* `identifier`: The slug for the given rule.
* `status_code`: The status code associated with the given evaluation failure.
### Examples
The following examples explain how to create alerts for particular situations:
* Consistent rule failures
To receive an alert whenever an individual rule consistently fails for five
minutes, [create a monitor](/investigate/alerts/monitors#create-a-monitor)
with the following query:
```text theme={null}
sum by (identifier) (rate(prometheus_rule_eval_failures_total[1m]))
```
with a **Sustain** of 5m.
You can also create an alert for monitoring individual rule failures:
```text theme={null}
sum by (identifier) (rate(prometheus_rule_eval_failures_total{type="
For each individual query, you can:
* Click **Run query** to re-run a query.
* Click the text bubble to create or edit a comment.
* Copy a query to the clipboard.
* Click the trash can to remove a query from the list.
* Click the **Star** to save a query. Starred queries show in the **Starred** tab.
By default, query history shows the most recent queries. You can change this from
the **Sort queries by** dropdown menu. The menu defaults to `Newest first`.
Search previous queries using the search box at the top of the list.
Use the slider to the left of the query list to filter queries over time.
### Query history settings
You can change the following settings for query history from the **Settings** tab:
* The period of time to save query history (default: 1 week)
* The default active tab (default: Query history tab)
* Only show queries for active data source (default: true)
* Clear query history
## Inspector
The **Inspector** helps you understand and troubleshoot queries. Available options
are:
* An overview of **Stats** for the query, including:
* **Total request time**
* **Data processing time**
* **Number of queries**
* **Total number rows**
* The **Query inspector**, which lets you to inspect the raw data.
* The **JSON** tab, to export the query as JSON.
* The **Data** tab, which shows raw data. Click **Download CSV** to export the data
to as a comma-separated values (CSV) file.
## Available metrics for troubleshooting
Additional metrics in your environment track the overall health of alerting and
recording rules that you've configured. The following examples are based on
Prometheus queries and troubleshooting.
Each metric has multiple labels you can use for slicing and monitoring, in the
following format:
* `metric_name`: metric\_description
* `label_name`: label\_description + use
Visit [Prometheus metric naming recommendations](/ingest/metrics-traces/collector/mappings/prometheus/prometheus-recommendations) for more
details about naming metrics.
Observability Platform provides the following metrics for troubleshooting:
* `prometheus_rule_group_last_duration_seconds`: A gauge metric that holds the total
time the group took to complete its last iteration, in seconds.
* `rule_group`: The group that this rule belongs to.
* `prometheus_rule_evaluation_duration_seconds`: A summary metric to track the
average time an individual rule takes to evaluate.
* `prometheus_rule_evaluations_total`: The total number of individual rule
evaluations that occur.
* `rule_group`: The group that this rule belongs to.
* `prometheus_rule_group_iterations_missed_total`: The total number of rule group
evaluations missed due to slow rule group evaluation.
* `rule_group`: The group that this rule belongs to.
* `prometheus_rule_group_iterations_total`: The total number of scheduled rule group
evaluations, whether executed or missed.
* `rule_group`: The group that this rule belongs to.
* `prometheus_rule_eval_failures_total`: The total number of individual rule
evaluation failures.
* `rule_group`: The group that this rule belongs to.
* `type`: Alerting or recording depending on the type of rule.
* `identifier`: The slug for the given rule.
* `status_code`: The status code associated with the given evaluation failure.
### Examples
The following examples explain how to create alerts for particular situations:
* Consistent rule failures
To receive an alert whenever an individual rule consistently fails for five
minutes, [create a monitor](/investigate/alerts/monitors#create-a-monitor)
with the following query:
```text theme={null}
sum by (identifier) (rate(prometheus_rule_eval_failures_total[1m]))
```
with a **Sustain** of 5m.
You can also create an alert for monitoring individual rule failures:
```text theme={null}
sum by (identifier) (rate(prometheus_rule_eval_failures_total{type="