> ## Documentation Index
> Fetch the complete documentation index at: https://docs.chronosphere.io/llms.txt
> Use this file to discover all available pages before exploring further.
# Troubleshooting missing metrics
Use the following information to help you understand and fix issues with your metric
data not displaying as expected.
## Dips in your metrics graphs
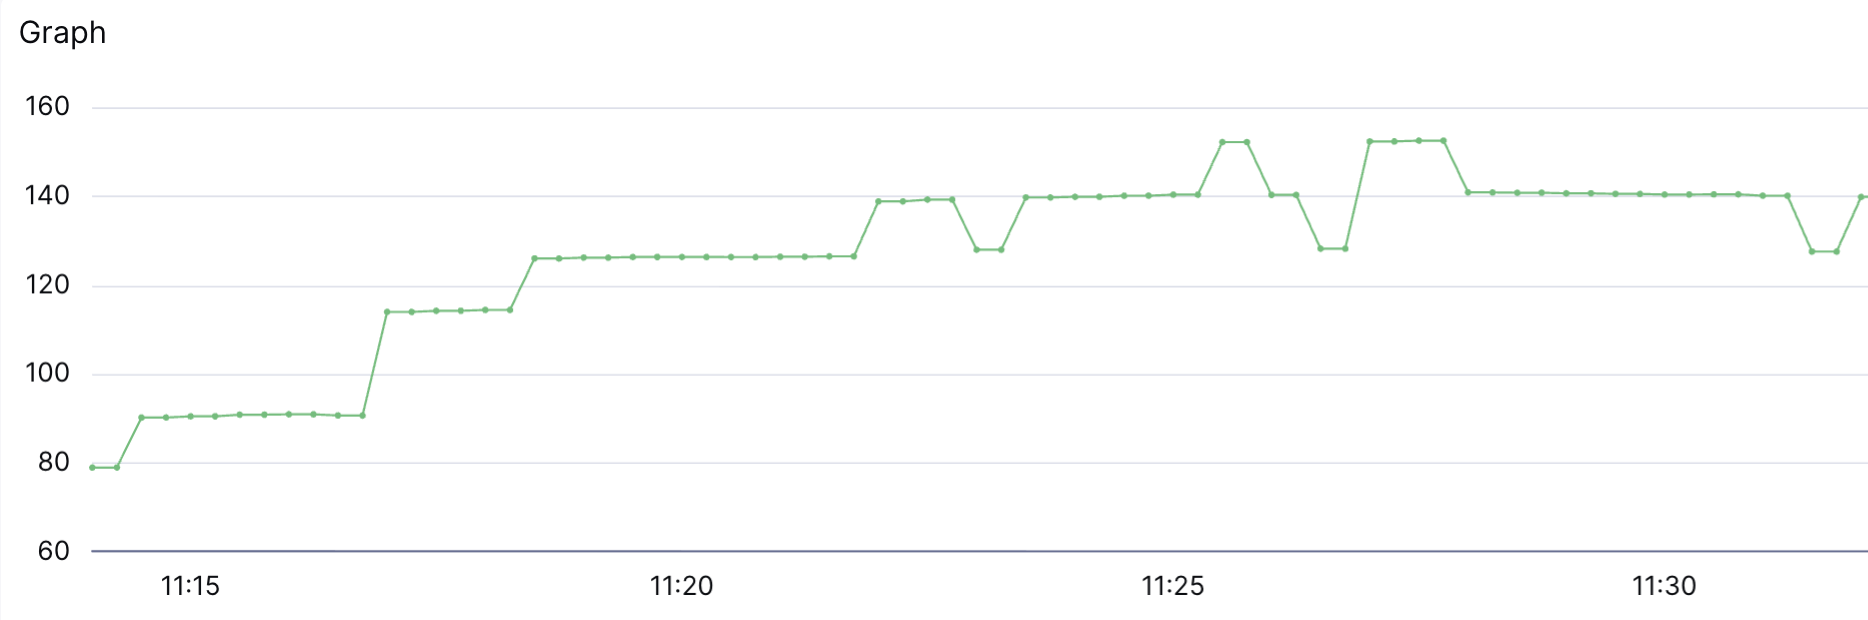
Chronosphere relies on two data points to emit aggregated metrics on counters. When a
change interrupts the data stream, Chronosphere has only one data point to operate on
in a given interval. In this instance, Chronosphere uses a null value for the
previous data point, which causes dips in the graphs using those counters.
Data stream changes that cause gaps in data collection can occur for several reasons:
* A deployment or instance change
* An unexpected failure of an aggregator or another part of the collection process
* A modification to a rollup rule for a counter
* The first scrape of a system that was already running
* Data that's more sparse than the in-memory buffer, such as a 10-minute buffer with
11-minute scrape intervals
This graphic shows the graphing behavior using a null value. This behavior
is consistent with the expected behavior of Prometheus.
 ## Sparse time series
Aggregated data on sparse time series over long look back windows can produce
inconsistent results when compared to querying raw data for the same period.
The aggregator has a 10 minute time to live (TTL) for time series. If a time series
has data points arriving less frequently than the 10-minute window, the aggregator is
unable to provide results that have the same fidelity as querying the raw data.
For example, Chronosphere receives a data point comes at `t0` and also at `t-30`. At
`t0`, the aggregator can't compare the datapoint to the one that came in at `t-30`,
so it records an increase as if the `t-30` datapoint were null. However, the raw,
non-aggregated data would have records for the datapoint at `t0` and `t-30`.
If a query looks for a rate across the raw data, the results retrieved include both
the accurate `t0` and the accurate `t-30` data points and supplies the correct
answer. Queries based on rollup data, retrieve some correct data points and others
that are misleading based on seemingly missing data and might be incorrect.
### Using a sparse metric in an arithmetic operation results in nil
In PromQL, combining time series with arithmetic operations where one operand is nil
results in the entire operation returning nil. A common pattern where this causes
issues is in calculating error rates. If you have a query like
`(total - failure) /total`, instead of returning some value when there are no
failures, nil is returned.
## Push based metrics issues
Data that looks like it has sparse time series can be due to
[latency](/ingest/metrics-traces/gcp#metrics-availability)
in metrics arrival or [long-term downsampling](/control/shaping/shape-metrics/downsampling).
Counter metrics often don't start with a zero (`0`) value, as they generally exist
before pushing data to Chronosphere. When this occurs, Chronosphere needs to wait for
multiple metrics to arrive before it can return an accurate measurement.
## Query for missing metrics
To visualize when metrics aren't emitting from a Prometheus endpoint, you can use a
specific combination of PromQL functions to build a repeatable query pattern. This
can be helpful when attempting to find flapping endpoints or endpoints that have gone
down.
### Query components
Here are the main functions that make up this query pattern:
* [**timestamp()**](https://prometheus.io/docs/prometheus/latest/querying/functions/#timestamp)
* [**unless()**](https://prometheus.io/docs/prometheus/latest/querying/operators/#logical-set-binary-operators)
* [**offset**](https://prometheus.io/docs/prometheus/latest/querying/basics/#offset-modifier)
For a complete list of functions, visit the [PromQL function documentation](https://prometheus.io/docs/prometheus/latest/querying/functions/).
### Query
This example, which implements all of the previous PromQL functions, examines metrics
emitted by the endpoint device and pushed to the Collector push endpoint. The time
test series metric that's used is `node_load1`.
```text theme={null}
timestamp(sum by (instance) (rate(node_load1{instance=~".+"}[5m]))) unless(timestamp(sum by
(instance) (rate(node_load1{instance=~".+"}[5m] offset 5m))))
```
The query identifies a time series, and then uses `unless()` to take the complement
of a second time series offset by five minutes.
If the metric is currently emitting and was also emitted five minutes in the past,
the complement is taken without plotting a point. However, if metrics aren't being
currently emitted, but were emitting five minutes in the past, the complement is
plotted.
### Example query pattern
```text theme={null}
(
timestamp(someMetric{})
unless
(timestamp(someMetric{})) offset 5m
)
```
### Graph
In the following graph, the empty portions are where metrics are being ingested. The
filled-in portions indicate where metrics aren't being sent. The length of the line
indicates the duration of time where metrics weren't sent.
## Sparse time series
Aggregated data on sparse time series over long look back windows can produce
inconsistent results when compared to querying raw data for the same period.
The aggregator has a 10 minute time to live (TTL) for time series. If a time series
has data points arriving less frequently than the 10-minute window, the aggregator is
unable to provide results that have the same fidelity as querying the raw data.
For example, Chronosphere receives a data point comes at `t0` and also at `t-30`. At
`t0`, the aggregator can't compare the datapoint to the one that came in at `t-30`,
so it records an increase as if the `t-30` datapoint were null. However, the raw,
non-aggregated data would have records for the datapoint at `t0` and `t-30`.
If a query looks for a rate across the raw data, the results retrieved include both
the accurate `t0` and the accurate `t-30` data points and supplies the correct
answer. Queries based on rollup data, retrieve some correct data points and others
that are misleading based on seemingly missing data and might be incorrect.
### Using a sparse metric in an arithmetic operation results in nil
In PromQL, combining time series with arithmetic operations where one operand is nil
results in the entire operation returning nil. A common pattern where this causes
issues is in calculating error rates. If you have a query like
`(total - failure) /total`, instead of returning some value when there are no
failures, nil is returned.
## Push based metrics issues
Data that looks like it has sparse time series can be due to
[latency](/ingest/metrics-traces/gcp#metrics-availability)
in metrics arrival or [long-term downsampling](/control/shaping/shape-metrics/downsampling).
Counter metrics often don't start with a zero (`0`) value, as they generally exist
before pushing data to Chronosphere. When this occurs, Chronosphere needs to wait for
multiple metrics to arrive before it can return an accurate measurement.
## Query for missing metrics
To visualize when metrics aren't emitting from a Prometheus endpoint, you can use a
specific combination of PromQL functions to build a repeatable query pattern. This
can be helpful when attempting to find flapping endpoints or endpoints that have gone
down.
### Query components
Here are the main functions that make up this query pattern:
* [**timestamp()**](https://prometheus.io/docs/prometheus/latest/querying/functions/#timestamp)
* [**unless()**](https://prometheus.io/docs/prometheus/latest/querying/operators/#logical-set-binary-operators)
* [**offset**](https://prometheus.io/docs/prometheus/latest/querying/basics/#offset-modifier)
For a complete list of functions, visit the [PromQL function documentation](https://prometheus.io/docs/prometheus/latest/querying/functions/).
### Query
This example, which implements all of the previous PromQL functions, examines metrics
emitted by the endpoint device and pushed to the Collector push endpoint. The time
test series metric that's used is `node_load1`.
```text theme={null}
timestamp(sum by (instance) (rate(node_load1{instance=~".+"}[5m]))) unless(timestamp(sum by
(instance) (rate(node_load1{instance=~".+"}[5m] offset 5m))))
```
The query identifies a time series, and then uses `unless()` to take the complement
of a second time series offset by five minutes.
If the metric is currently emitting and was also emitted five minutes in the past,
the complement is taken without plotting a point. However, if metrics aren't being
currently emitted, but were emitting five minutes in the past, the complement is
plotted.
### Example query pattern
```text theme={null}
(
timestamp(someMetric{})
unless
(timestamp(someMetric{})) offset 5m
)
```
### Graph
In the following graph, the empty portions are where metrics are being ingested. The
filled-in portions indicate where metrics aren't being sent. The length of the line
indicates the duration of time where metrics weren't sent.
 ### Alert
To send an alert when metrics are no longer being emitted, look for values greater
than zero.
## Managing invalid metrics
Observability Platform drops time series when they violate the following validation
checks, and can also reject data if you exceed
[defined limits](/administer/limits-licensing/limits/metric-limits). To understand
metric size limits and how Observability Platform handles shortening label values,
see [size limits](/administer/limits-licensing/limits/metric-limits#size-limits).
For more information about invalid series being rejected, contact
[Chronosphere Support](/support).
If you send a metric to Chronosphere exceeding these limits, such as sending a label
value that's 2,000 characters long, Observability Platform returns an HTTP `200 OK`
status code and drops the invalid series.
When Observability Platform drops an invalid series, use the following dashboards to
review information about dropped data:
* The [Chronosphere Health Check](/observe/dashboards/managed-dashboards#chronosphere-health-check)
dashboard includes a panel that shows the rate of rejected data points from all
ingestion sources, displayed by the rejection reason.
* The [OpenTelemetry Ingestion & Health](/observe/dashboards/managed-dashboards#opentelemetry-ingestion-health)
dashboard includes a panel showing the rate of rejected OTLP metrics data points,
displayed by reason.
You can also run the following query in [Metrics Explorer](/investigate/querying/metrics/explorer)
to return invalid time series metrics.
```text theme={null}
sum by (source, reason) (rate(metrics_api_data_points_rejected{}[5m]))
```
This query returns the rate of rejected data points by ingestion source and rejection
reason. For example:
| Name | Total | Max | Avg | Last |
| --------------------------------------------------------- | ----- | ----- | ----- | ----- |
| `{reason="label_count_too_high",source="open_telemetry"}` | 17K | 130.5 | 70.7 | 73.8 |
| `{reason="label_count_too_high",source="prometheus"}` | 57.7 | 0.281 | 0.24 | 0.225 |
| `{reason="label_name_invalid",source="open_telemetry"}` | 78.7 | 0.411 | 0.327 | 0.358 |
### Labels with empty values
Observability Platform drops labels with empty values from the time series, and then
accepts the resulting time series.
For example, in the following time series:
```text theme={null}
my_metric{my_label="example_label", my_empty_label=""}
```
Observability Platform drops the label named `my_empty_label` at ingestion, and then
accepts the following time series for processing:
```text theme={null}
my_metric{my_label="example_label"}
```
### Invalid characters
Metrics that don't match
[Prometheus naming conventions](/ingest/metrics-traces/collector/mappings/prometheus/prometheus-recommendations)
might be dropped at ingestion due to special characters.
### Timestamp in the past
Observability Platform might reject metrics that are too far in the past. See
[late arriving metrics](/administer/limits-licensing/limits/metric-limits#late-arriving-metrics)
for more information about the time period in which Observability Platform can accept
late metrics.
### Missing OpenTelemetry attribute
Observability Platform requires the `service.instance.id` attribute for all
OpenTelemetry metric time series to ensure metric writer uniqueness. For more
information, see the OpenTelemetry documentation regarding a
[single logical writer](https://opentelemetry.io/docs/specs/otel/metrics/data-model/#single-writer).
Observability Platform rejects metrics without a `service.instance.id` resource
attribute. To configure a value for this attribute, follow the recommendations
for
[mapping resource attributes to a Prometheus job and instance](/ingest/metrics-traces/otel/otel-ingest#map-resource-attributes-to-prometheus-job-and-instance).
### Unsupported metric types
Observability Platform supports all Prometheus and OpenTelemetry metric types, except
for the OpenTelemetry non-monotonic delta sum metric type. See
[metric types](/control/shaping/shape-metrics/types) for information about supported
metric types.
### Alert
To send an alert when metrics are no longer being emitted, look for values greater
than zero.
## Managing invalid metrics
Observability Platform drops time series when they violate the following validation
checks, and can also reject data if you exceed
[defined limits](/administer/limits-licensing/limits/metric-limits). To understand
metric size limits and how Observability Platform handles shortening label values,
see [size limits](/administer/limits-licensing/limits/metric-limits#size-limits).
For more information about invalid series being rejected, contact
[Chronosphere Support](/support).
If you send a metric to Chronosphere exceeding these limits, such as sending a label
value that's 2,000 characters long, Observability Platform returns an HTTP `200 OK`
status code and drops the invalid series.
When Observability Platform drops an invalid series, use the following dashboards to
review information about dropped data:
* The [Chronosphere Health Check](/observe/dashboards/managed-dashboards#chronosphere-health-check)
dashboard includes a panel that shows the rate of rejected data points from all
ingestion sources, displayed by the rejection reason.
* The [OpenTelemetry Ingestion & Health](/observe/dashboards/managed-dashboards#opentelemetry-ingestion-health)
dashboard includes a panel showing the rate of rejected OTLP metrics data points,
displayed by reason.
You can also run the following query in [Metrics Explorer](/investigate/querying/metrics/explorer)
to return invalid time series metrics.
```text theme={null}
sum by (source, reason) (rate(metrics_api_data_points_rejected{}[5m]))
```
This query returns the rate of rejected data points by ingestion source and rejection
reason. For example:
| Name | Total | Max | Avg | Last |
| --------------------------------------------------------- | ----- | ----- | ----- | ----- |
| `{reason="label_count_too_high",source="open_telemetry"}` | 17K | 130.5 | 70.7 | 73.8 |
| `{reason="label_count_too_high",source="prometheus"}` | 57.7 | 0.281 | 0.24 | 0.225 |
| `{reason="label_name_invalid",source="open_telemetry"}` | 78.7 | 0.411 | 0.327 | 0.358 |
### Labels with empty values
Observability Platform drops labels with empty values from the time series, and then
accepts the resulting time series.
For example, in the following time series:
```text theme={null}
my_metric{my_label="example_label", my_empty_label=""}
```
Observability Platform drops the label named `my_empty_label` at ingestion, and then
accepts the following time series for processing:
```text theme={null}
my_metric{my_label="example_label"}
```
### Invalid characters
Metrics that don't match
[Prometheus naming conventions](/ingest/metrics-traces/collector/mappings/prometheus/prometheus-recommendations)
might be dropped at ingestion due to special characters.
### Timestamp in the past
Observability Platform might reject metrics that are too far in the past. See
[late arriving metrics](/administer/limits-licensing/limits/metric-limits#late-arriving-metrics)
for more information about the time period in which Observability Platform can accept
late metrics.
### Missing OpenTelemetry attribute
Observability Platform requires the `service.instance.id` attribute for all
OpenTelemetry metric time series to ensure metric writer uniqueness. For more
information, see the OpenTelemetry documentation regarding a
[single logical writer](https://opentelemetry.io/docs/specs/otel/metrics/data-model/#single-writer).
Observability Platform rejects metrics without a `service.instance.id` resource
attribute. To configure a value for this attribute, follow the recommendations
for
[mapping resource attributes to a Prometheus job and instance](/ingest/metrics-traces/otel/otel-ingest#map-resource-attributes-to-prometheus-job-and-instance).
### Unsupported metric types
Observability Platform supports all Prometheus and OpenTelemetry metric types, except
for the OpenTelemetry non-monotonic delta sum metric type. See
[metric types](/control/shaping/shape-metrics/types) for information about supported
metric types.