> ## Documentation Index
> Fetch the complete documentation index at: https://docs.chronosphere.io/llms.txt
> Use this file to discover all available pages before exploring further.
# Search and filter trace data
In Trace Explorer, use the **Query builder** to [define a search](#define-a-search).
You can search traces by their unique ID, or by the details of the individual spans
in a given trace. Use [multiple span criteria](#query-with-multiple-span-criteria) in
your search to equate to different evaluations. Use
[search optimizations](#search-optimizations) to help find interesting traces and
focus on specific use cases such as `N+1` issues.
After an initial search returns results, you can also
[group and narrow results](#group-and-narrow-results) to specific attributes.
To identify trends and immediately scan through all related tags and values to
pinpoint the exact `tag:value` pairs most closely correlated with suspicious
behavior, use [Differential Diagnosis](/investigate/analyze/differential-diagnosis/traces).
If any criteria or combination of selected criteria don't match *at least one span*,
the query returns zero results.
## Define a search
Use the **Query builder** to search for traces and spans so that you can identify,
triage, and understand the root cause of problems. Add one or more span filters
combined with the [query syntax](#search-query-syntax) to additionally refine the
trace results. These filters match spans within a trace based on criteria you select.
You can choose to match on operations, services, or tags in your search.
For example, you might want to search for any traces that include a span with an
operation named `/paymentstore.PaymentStore/Capture`, which captures all payment
information to your app. You can then add another span filter in a new row to exclude
traces where any other span contains a tag like `geo=fr` to filter out any payments
made in France.
You can define a search to query traces directly
[from a dashboard](/observe/dashboards/query-traces). This ability lets you search
your trace data without having to navigate to Trace Explorer.
To search traces:
1. In the navigation menu select
** Explorers > Trace Explorer**.
2. Choose the time period to display results for, which defaults to the last 15
minutes.
When choosing a time window, selecting a period longer than one day greatly
impacts load time for search results. For optimal results, scope search queries to
shorter time periods.
3. Use the **Query builder** to define the criteria of your search:
* Select one of the following filters to match spans within a trace based on criteria you select:
* **At least** narrows trace results to include only results those that contain
*at least* the specified number of spans matching the specified criteria. This
selection equates to greater than or equal to the number of specified spans.
All trace searches in Trace Explorer default to finding traces where at least
one span matches the specified criteria.
* **Fewer than** narrows trace results to include fewer than the specified
number of spans containing the specified criteria. This selection equates to
*less than* the number of specified spans.
* **Exactly** narrows trace results to the specified number of spans containing
the specified criteria *exactly*.
* **Zero** narrows trace results to those where zero spans contain the specified
criteria. This selection helps to filter out specific services, operations,
and tags from results.
* **Root** narrows trace results to include only spans containing the specified
criteria at the root of a trace. This selection helps focus on spans for a
specific service or operation you know is experiencing issues.
* In the search bar, use the [search query syntax](#search-query-syntax) to enter
span criteria to match on, which can be a combination of values for service,
operation, and span metadata (such as span errors and span duration).
For example, the following query returns all traces where *at least one span*
includes a service called `billing-svc`, an operation that starts with
`execute`, and a tag named `build.version` where the value equals `1.54`:
```text theme={null}
service="billing-svc" operation=~"^execute*." build.version="v1.54"
```
You can also click **Trace ID** to enter a unique trace ID to search for a
specific trace, such as `19323ae9283b8fea000f63bff84524a0`. Use this feature if
you received an alert containing a trace ID to go directly to that trace.
* Enter any tags for matching as key/value pairs. For example, you might want to
return traces with any span that has `environment=production` to focus your
search only on production environments.
* Choose which traces to include in your search results:
* **Any trace result**: Include any traces matching the specified criteria.
* **Failed traces only**: Include only traces that have errors in the root span
or trace.
* **Successful traces only**: Include only traces that don't contain any errors
in the root span or trace.
* Select the minimum and maximum duration of traces (in seconds) to include in
your search.
Trace duration is calculated as the time elapsed from the earliest to the latest
observed timestamps across all spans for a given trace.
* Select a time range for your query, which defaults to the last 15 minutes.
4. Click **Run** to submit your query. You must click
**Run** after each time you modify the query criteria.
You can press `Control+Return` or `Control+Enter` on your
keyboard instead of clicking **Run** to submit a
query.
If the time range for your query is broad, such as the last five days, Trace
Explorer loads results progressively. As results are available, you can click
**Display more results** on the **Span statistics**,
**Differential Diagnosis (DDx)**, or **Topology view** tabs to view partial
results.
When all results are available, click **Display complete results** to view the
complete list of results.
5. To display a natural language summary of your query, click **Show summary**.
For example, the summary for the previous query displays as:
> All traces in the selected time range where **at least one span** has service
> **"billing-svc" operation=\~"^execute\*."** and has the tag **build.version="v1.54**.
Click **Hide summary** to hide the search summary.
6. To refine your search, click **Add span criteria** and
specify additional span properties to include or exclude.
Each row is a separate span filter that Observability Platform evaluates against
individual spans. When you include
[multiple span filter rows](#query-with-multiple-span-criteria), Observability
Platform combines the filter rows as "and also" operations.
Observability Platform finds traces where one span matches all criteria in the first row,
and also where *at least one* other span matches all criteria in subsequent rows.
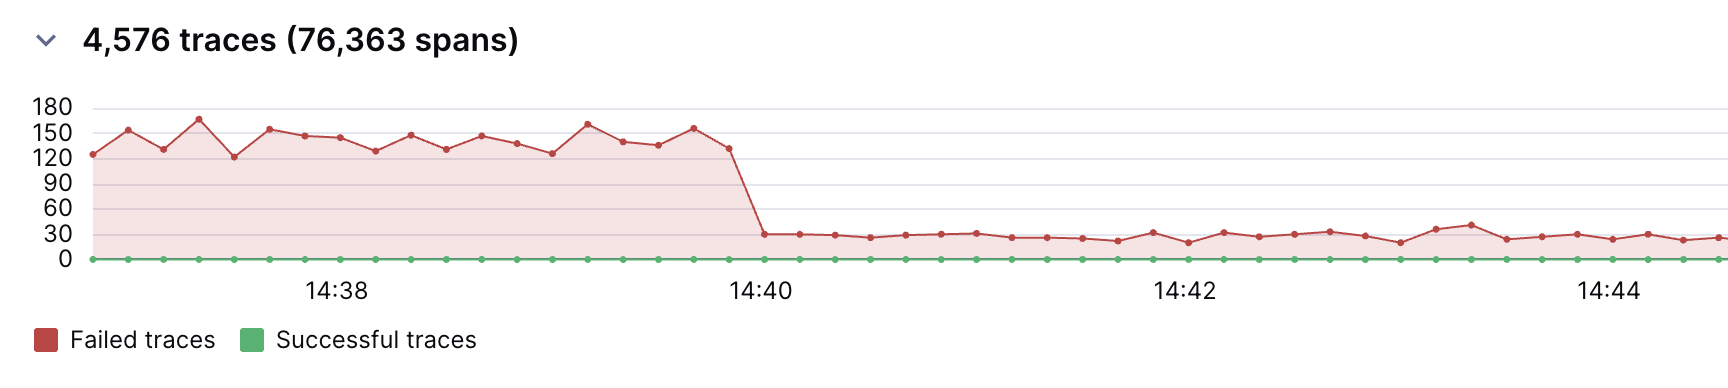
As you modify your search, the search timeline graph updates in real time, along
with the statistics, traces, and topology views. The timeline shows an overview of
the current search, with counts of successful and failed traces plotted over time.
 7. To copy a short URL to your clipboard you can share with other users,
click **Copy URL**. Use this capability for sharing links
of complicated queries that can generate long URLs.
Observability Platform permanently stores short URLs in your tenant so that they
don't expire.
8. To learn more about the spans in a trace, click the **Trace list** tab. Click the name
of a trace in the **Trace** column to open the trace details page, which displays
information for each of the spans that make up the trace.
9. On the trace details page, narrow the displayed data with the following
options:
* Use the menus to scope spans to specific criteria, which defaults to **Service**
and **Operation**. Selecting a different attribute updates the entire column, so
selecting a tag like `build.version` changes the selected column to that
attribute.
These menus let you search through a specific trace to find matches for
individual spans based on different attributes, which can help when debugging
issues in a specific trace.
* Use the **Only Errors** toggle to display only segments of each trace that
contain errors.
* Use the **Only Critical Path** toggle to highlight segments of each span that
impact the total duration of a trace. These segments help to identify latency
issues within the trace. Resolving these issues can lead to the greatest
improvement in latency of the entire trace.
You can additionally filter results to only the criteria you select. Available
criteria, such as service, operation, and tag, are scoped to the current query
results only.
* Use the **Filter by service, operation, duration, span kind, or external parent**
menu to filter search results to a selected service or operation, by a duration
value, or by a span kind.
* Use the **Filter by tag or process** menu to filter search results to a specific
tag or process.
10. In the **Span details** pane, hold the pointer over an attribute to display
additional options:
* Click the copy button to copy the selected
`tag:value` pair, which you can paste into the **Query builder** of the
**Trace Explorer** page
* Click the three vertical dots icon and click
**Search for similar traces** to open the **Traces** drawer and display traces
that are similar to the selected span. Using the selected search criteria, you
can use [Differential Diagnosis](/investigate/analyze/differential-diagnosis/traces)
to continue analyzing data, or start a new search in Trace Explorer.
* On the **Span ID** field, click the three
vertical dots icon and then click **Scope trace to span** to scope the trace
details to the selected span and its children. This option is similar to the
**Span topology map** option in the
[**Span details**](/investigate/querying/traces/features#span-details) panel.
11. Use the following filters in the **Query builder** to limit search results to
specific criteria:
* To filter search results to the critical path, in the top navigation, click
**Statistics**. In the search bar of the **Query builder**, select **At least**
and then select `critical path` as the label to match, and `true` as the value.
The search results update to display spans that can help to identify latency
issues within the trace. Resolving these issues can lead to the greatest
improvement in latency of the entire trace.
* To filter search results to leaf errors, in the search bar of the **Query
builder**, enter `leaf error` as the label to match, and `true` as the value.
The search results update to display error spans that have no failing child
spans. Leaf errors help filter out propagated errors, and provide clearer
signals about the source of an error that might be causing the entire trace to
fail.
12. To clear all selected options in the **Query builder**, click **Clear**.
### Search optimizations
When [defining a search](#define-a-search) in Trace Explorer, use the following
optimizations to help find traces for specific use cases.
* To diagnose `N+1` issues, search for traces where at least one or more spans match
the service or operation experiencing issues. For example, at least 10 spans matching
service `billing-service` returns all traces where `billing-service` is called 10 or
more times.
* To find interesting traces, combine criteria at the span and trace level. For
example, you can return traces that were successful but have errors somewhere in
the underlying spans. These "recovered error" traces can identify problems that
aren't causing outright failures, but might merit investigation to prevent future
errors. To locate these traces, enter `error` as the label to match and `true`
as the value in the search bar, and then select **Successful traces only**.
* To find traces exhibiting specific behavior, combine span duration and trace
duration filters. For example, to find traces where the full path took no more than five
seconds, but where a specific span matching `service=billing_svc` took up at least
half that time, define a search that includes `service=billing_svc`
and `duration>"2.5"`, with a maximum trace duration of five seconds.
* To search for traces from long-running jobs, such as machine learning jobs, use the
**Custom tags** field in the **Query builder** in Trace Explorer. Enter
`parent_missing` as the label to match, and `true` as the value. These traces often
arrive with missing spans from segments of the trace that arrived later than
others. Observability Platform identifies these spans for the selected trace as
**\** in the **Span details** panel.
When more than one trace is found with the same trace ID, in the trace details
view, a button displays to **Display more results**. This capability helps to
stitch together longer traces if they arrived separated during ingestion, which can
help identify leaf errors for the entire trace.
* To find traces that were sampled by the behaviors on a particular dataset, use the
**Custom tags** field in the **Query builder** in Trace Explorer to search for the
`behavior_dataset_slug` tag. Because traces can belong to multiple datasets, this
tag identifies the dataset that was used to determine the active behavior that
shaped traces during processing.
This visibility helps to inform decisions about which
[behavior](/control/shaping/sample-traces/behaviors) to modify to increase or decrease the
number of traces you sample. For example, if you identify a trace with 200,000
spans, you can use the `behavior_dataset_slug` tag to determine which dataset's
behavior to change to alter the sampling rate.
### Query with multiple span criteria
Including multiple span criteria in a single row constitutes an `AND` evaluation. You
can define a query in a single row or on multiple rows, which equate to different
evaluations.
To find traces where a service uses one operation but not another operation, create a
search with two rows: one row where at least one span matches a particular service,
and another row where zero spans match the other service. For example, a query row
where at least one span matches service `billing-service` and operation `query`, and
a second row where exactly zero spans match operation `checkout`.
* **Single query row**: If you enter multiple criteria in the same query row,
Chronosphere Observability Platform evaluates them as `AND` criteria for any single
span in a trace. For example, the following query returns spans that include both
the `ordering-svc` service and the `/ordering.Ordering/FetchItem` operation:
```text theme={null}
service="ordering-svc" operation="/ordering.Ordering/FetchItem"
```
* **Multiple query rows**: If you specify queries on multiple rows, Observability
Platform evaluates all criteria in the first query against all possible matching
spans, and then evaluates criteria in subsequent queries against matching spans.
Observability Platform only returns traces where at least one span matches the
first query and also *at least one more span* matches additional queries.
Using multiple query rows equates to, "Find all traces with at least one span
matching the first span criteria, and also *at least one* span matching this other
criteria." Each query row is equal to another span in the trace.
The previous query, when defined on separate query rows, returns spans that include
the `ordering-svc` service, and *at least one other* span that includes the
`/ordering.Ordering/FetchItem` operation:
```text theme={null}
service="ordering-svc"
operation="/ordering.Ordering/FetchItem"
```
### Search query syntax
To define the properties you want to search for, you must use a particular search
syntax. This syntax is a key followed by an operator and a value, surrounded by
double quotes.
```text theme={null}
KEY =|!=|=~|!~ "VALUE"
```
In the **Query builder** section of the **Trace Explorer** page, click
**Syntax helper** to display a dialog with syntax examples.
Use the following syntax to match specific properties:
| Type | Operator | Example |
| ------------------- | -------------------------- | --------------------------- |
| Exact matches | `=` | `operation="operation123"` |
| Doesn't match | `!=` | `operation!="operation123"` |
| Regular expressions | `=~` \| `!~` | `service=~"production-.*"` |
| Duration | `>` \| `<` | `duration>"3.2"` |
| Span count | `>` \| `>=` \| `<` \| `<=` | `span_count>="100"` |
| Boolean values | `true` \| `false` | `error="true"` |
| Missing spans | `=` | `parent_missing="true"` |
You can also use the doesn't match (`!=`) operator to create a negation query. For
example, construct an **At least** query where at least one span contains
`service="billing-svc"`, but `operation!=checkout` indicates that the query returns
traces where the specified number of spans contain `billing-service` but don't
contain `operation!=checkout`. This kind of query can help filter out combinations of
service and operation.
### Group and narrow results
After an initial search returns results, you can also group and narrow your results
to specific attributes.
Use the **Group by** field to retrieve and display the aggregated results grouped by
up to *three* different attributes, such as service, operation, and build version.
This combination helps to identify spikes in requests or errors in a particular
version of your software. Grouping by related attributes helps to highlight and
better understand existing issues, such as anomalous error rates, based on specific
properties.
To identify upstream issues, use the parent or root options of the **Group by**
field:
* **Parent service** or **Parent operation**: Use these options to identify issues
directly upstream from a particular service or operation. Selecting the parent can
help identify which upstream service is generating requests.
* **Root service** or **Root operation**: Use these options to identify the upstream
root service or operation that initiates requests to a particular service or
operation. Selecting the root can help identify where the most requests to a
service originate, and can inform which service to increase sampling for to
generate additional trace data.
You can additionally narrow your results with the **Filters** field. Enter a specific
attribute to narrow your results to that attribute only, such as a specific service
or operation. You can use this field independently or in conjunction with the
**Group by** field. This field works with the **Span statistics** table and **Topology view**.
For example, you might have a payment app that includes a service named
`payment`, and you want to explore issues with that service.
To group and narrow results:
1. In the **Query builder**, enter `service="payment"` to include that service in
your query.
2. In the **Group by** menu, select **Operation** to group results by both service
and operation. By default, Observability Platform groups by **Service**.
In the **Span statistics** table, you notice that the `charge` operation has a
high request rate. This operation tracks all authorized payments to your app.
3. In the **Filters** field, enter the `charge` operation to focus your results to
only that attribute.
You want to view all credit card brands that users made payments with through the
`charge` operation.
4. In the **Group by** field, enter **app.payment.card\_type** to additionally group
your results by that attribute.
You identify `visa` as the credit card brand with the highest request rate among
all cards that users make payments with.
7. To copy a short URL to your clipboard you can share with other users,
click **Copy URL**. Use this capability for sharing links
of complicated queries that can generate long URLs.
Observability Platform permanently stores short URLs in your tenant so that they
don't expire.
8. To learn more about the spans in a trace, click the **Trace list** tab. Click the name
of a trace in the **Trace** column to open the trace details page, which displays
information for each of the spans that make up the trace.
9. On the trace details page, narrow the displayed data with the following
options:
* Use the menus to scope spans to specific criteria, which defaults to **Service**
and **Operation**. Selecting a different attribute updates the entire column, so
selecting a tag like `build.version` changes the selected column to that
attribute.
These menus let you search through a specific trace to find matches for
individual spans based on different attributes, which can help when debugging
issues in a specific trace.
* Use the **Only Errors** toggle to display only segments of each trace that
contain errors.
* Use the **Only Critical Path** toggle to highlight segments of each span that
impact the total duration of a trace. These segments help to identify latency
issues within the trace. Resolving these issues can lead to the greatest
improvement in latency of the entire trace.
You can additionally filter results to only the criteria you select. Available
criteria, such as service, operation, and tag, are scoped to the current query
results only.
* Use the **Filter by service, operation, duration, span kind, or external parent**
menu to filter search results to a selected service or operation, by a duration
value, or by a span kind.
* Use the **Filter by tag or process** menu to filter search results to a specific
tag or process.
10. In the **Span details** pane, hold the pointer over an attribute to display
additional options:
* Click the copy button to copy the selected
`tag:value` pair, which you can paste into the **Query builder** of the
**Trace Explorer** page
* Click the three vertical dots icon and click
**Search for similar traces** to open the **Traces** drawer and display traces
that are similar to the selected span. Using the selected search criteria, you
can use [Differential Diagnosis](/investigate/analyze/differential-diagnosis/traces)
to continue analyzing data, or start a new search in Trace Explorer.
* On the **Span ID** field, click the three
vertical dots icon and then click **Scope trace to span** to scope the trace
details to the selected span and its children. This option is similar to the
**Span topology map** option in the
[**Span details**](/investigate/querying/traces/features#span-details) panel.
11. Use the following filters in the **Query builder** to limit search results to
specific criteria:
* To filter search results to the critical path, in the top navigation, click
**Statistics**. In the search bar of the **Query builder**, select **At least**
and then select `critical path` as the label to match, and `true` as the value.
The search results update to display spans that can help to identify latency
issues within the trace. Resolving these issues can lead to the greatest
improvement in latency of the entire trace.
* To filter search results to leaf errors, in the search bar of the **Query
builder**, enter `leaf error` as the label to match, and `true` as the value.
The search results update to display error spans that have no failing child
spans. Leaf errors help filter out propagated errors, and provide clearer
signals about the source of an error that might be causing the entire trace to
fail.
12. To clear all selected options in the **Query builder**, click **Clear**.
### Search optimizations
When [defining a search](#define-a-search) in Trace Explorer, use the following
optimizations to help find traces for specific use cases.
* To diagnose `N+1` issues, search for traces where at least one or more spans match
the service or operation experiencing issues. For example, at least 10 spans matching
service `billing-service` returns all traces where `billing-service` is called 10 or
more times.
* To find interesting traces, combine criteria at the span and trace level. For
example, you can return traces that were successful but have errors somewhere in
the underlying spans. These "recovered error" traces can identify problems that
aren't causing outright failures, but might merit investigation to prevent future
errors. To locate these traces, enter `error` as the label to match and `true`
as the value in the search bar, and then select **Successful traces only**.
* To find traces exhibiting specific behavior, combine span duration and trace
duration filters. For example, to find traces where the full path took no more than five
seconds, but where a specific span matching `service=billing_svc` took up at least
half that time, define a search that includes `service=billing_svc`
and `duration>"2.5"`, with a maximum trace duration of five seconds.
* To search for traces from long-running jobs, such as machine learning jobs, use the
**Custom tags** field in the **Query builder** in Trace Explorer. Enter
`parent_missing` as the label to match, and `true` as the value. These traces often
arrive with missing spans from segments of the trace that arrived later than
others. Observability Platform identifies these spans for the selected trace as
**\** in the **Span details** panel.
When more than one trace is found with the same trace ID, in the trace details
view, a button displays to **Display more results**. This capability helps to
stitch together longer traces if they arrived separated during ingestion, which can
help identify leaf errors for the entire trace.
* To find traces that were sampled by the behaviors on a particular dataset, use the
**Custom tags** field in the **Query builder** in Trace Explorer to search for the
`behavior_dataset_slug` tag. Because traces can belong to multiple datasets, this
tag identifies the dataset that was used to determine the active behavior that
shaped traces during processing.
This visibility helps to inform decisions about which
[behavior](/control/shaping/sample-traces/behaviors) to modify to increase or decrease the
number of traces you sample. For example, if you identify a trace with 200,000
spans, you can use the `behavior_dataset_slug` tag to determine which dataset's
behavior to change to alter the sampling rate.
### Query with multiple span criteria
Including multiple span criteria in a single row constitutes an `AND` evaluation. You
can define a query in a single row or on multiple rows, which equate to different
evaluations.
To find traces where a service uses one operation but not another operation, create a
search with two rows: one row where at least one span matches a particular service,
and another row where zero spans match the other service. For example, a query row
where at least one span matches service `billing-service` and operation `query`, and
a second row where exactly zero spans match operation `checkout`.
* **Single query row**: If you enter multiple criteria in the same query row,
Chronosphere Observability Platform evaluates them as `AND` criteria for any single
span in a trace. For example, the following query returns spans that include both
the `ordering-svc` service and the `/ordering.Ordering/FetchItem` operation:
```text theme={null}
service="ordering-svc" operation="/ordering.Ordering/FetchItem"
```
* **Multiple query rows**: If you specify queries on multiple rows, Observability
Platform evaluates all criteria in the first query against all possible matching
spans, and then evaluates criteria in subsequent queries against matching spans.
Observability Platform only returns traces where at least one span matches the
first query and also *at least one more span* matches additional queries.
Using multiple query rows equates to, "Find all traces with at least one span
matching the first span criteria, and also *at least one* span matching this other
criteria." Each query row is equal to another span in the trace.
The previous query, when defined on separate query rows, returns spans that include
the `ordering-svc` service, and *at least one other* span that includes the
`/ordering.Ordering/FetchItem` operation:
```text theme={null}
service="ordering-svc"
operation="/ordering.Ordering/FetchItem"
```
### Search query syntax
To define the properties you want to search for, you must use a particular search
syntax. This syntax is a key followed by an operator and a value, surrounded by
double quotes.
```text theme={null}
KEY =|!=|=~|!~ "VALUE"
```
In the **Query builder** section of the **Trace Explorer** page, click
**Syntax helper** to display a dialog with syntax examples.
Use the following syntax to match specific properties:
| Type | Operator | Example |
| ------------------- | -------------------------- | --------------------------- |
| Exact matches | `=` | `operation="operation123"` |
| Doesn't match | `!=` | `operation!="operation123"` |
| Regular expressions | `=~` \| `!~` | `service=~"production-.*"` |
| Duration | `>` \| `<` | `duration>"3.2"` |
| Span count | `>` \| `>=` \| `<` \| `<=` | `span_count>="100"` |
| Boolean values | `true` \| `false` | `error="true"` |
| Missing spans | `=` | `parent_missing="true"` |
You can also use the doesn't match (`!=`) operator to create a negation query. For
example, construct an **At least** query where at least one span contains
`service="billing-svc"`, but `operation!=checkout` indicates that the query returns
traces where the specified number of spans contain `billing-service` but don't
contain `operation!=checkout`. This kind of query can help filter out combinations of
service and operation.
### Group and narrow results
After an initial search returns results, you can also group and narrow your results
to specific attributes.
Use the **Group by** field to retrieve and display the aggregated results grouped by
up to *three* different attributes, such as service, operation, and build version.
This combination helps to identify spikes in requests or errors in a particular
version of your software. Grouping by related attributes helps to highlight and
better understand existing issues, such as anomalous error rates, based on specific
properties.
To identify upstream issues, use the parent or root options of the **Group by**
field:
* **Parent service** or **Parent operation**: Use these options to identify issues
directly upstream from a particular service or operation. Selecting the parent can
help identify which upstream service is generating requests.
* **Root service** or **Root operation**: Use these options to identify the upstream
root service or operation that initiates requests to a particular service or
operation. Selecting the root can help identify where the most requests to a
service originate, and can inform which service to increase sampling for to
generate additional trace data.
You can additionally narrow your results with the **Filters** field. Enter a specific
attribute to narrow your results to that attribute only, such as a specific service
or operation. You can use this field independently or in conjunction with the
**Group by** field. This field works with the **Span statistics** table and **Topology view**.
For example, you might have a payment app that includes a service named
`payment`, and you want to explore issues with that service.
To group and narrow results:
1. In the **Query builder**, enter `service="payment"` to include that service in
your query.
2. In the **Group by** menu, select **Operation** to group results by both service
and operation. By default, Observability Platform groups by **Service**.
In the **Span statistics** table, you notice that the `charge` operation has a
high request rate. This operation tracks all authorized payments to your app.
3. In the **Filters** field, enter the `charge` operation to focus your results to
only that attribute.
You want to view all credit card brands that users made payments with through the
`charge` operation.
4. In the **Group by** field, enter **app.payment.card\_type** to additionally group
your results by that attribute.
You identify `visa` as the credit card brand with the highest request rate among
all cards that users make payments with.
 5. Click the bar in the results set that includes **visa**, and in the resulting
dialog, click **Differential Diagnosis (DDx)**.
Use [Differential Diagnosis](/investigate/analyze/differential-diagnosis/traces) to
further investigate trends in your data and remediate related issues.
## Access recent searches
When investigating issues, you might run the same search frequently. Rather than
redefining the search query, use recent searches to access previous searches. You can
run a search from a previous time period and inspect the parameters of a previous
search by clicking the search from the list.
For example, you can run a fully defined search query from one day ago for a
particular time period. Queries run based on the relative time parameters from the
recent search. If the selected time window of the query is the **Last 15 minutes**,
the query pulls data from the last 15 minutes in current time, and not the last 15
minutes from when the search ran initially.
To access recent searches:
1. In the navigation menu select
** Explorers > Trace Explorer**.
2. In the **Search for Traces** pane, click **View searches**.
3. Click the **Recent** tab, locate the search that you want to run, and click it.
The parameters in the recent search override any trace or span information
in the current **Query builder**.
## Save frequent searches
If you find that you're accessing a recent search frequently, you can save the search
so that it's always available to you. Saved searches are like bookmarks that you can
reference whenever you need them.
To save a search:
1. In the navigation menu select
** Explorers > Trace Explorer**.
2. Define the criteria of your search.
3. Click **Save search**.
4. In the **Save search** panel, enter a name for your search.
5. Click **Save**.
To view your saved search, click **View searches**. Your saved search displays in the
**Saved** tab.
To share your search, click **Copy URL** to copy a short URL
to your clipboard that you can share with other users.
5. Click the bar in the results set that includes **visa**, and in the resulting
dialog, click **Differential Diagnosis (DDx)**.
Use [Differential Diagnosis](/investigate/analyze/differential-diagnosis/traces) to
further investigate trends in your data and remediate related issues.
## Access recent searches
When investigating issues, you might run the same search frequently. Rather than
redefining the search query, use recent searches to access previous searches. You can
run a search from a previous time period and inspect the parameters of a previous
search by clicking the search from the list.
For example, you can run a fully defined search query from one day ago for a
particular time period. Queries run based on the relative time parameters from the
recent search. If the selected time window of the query is the **Last 15 minutes**,
the query pulls data from the last 15 minutes in current time, and not the last 15
minutes from when the search ran initially.
To access recent searches:
1. In the navigation menu select
** Explorers > Trace Explorer**.
2. In the **Search for Traces** pane, click **View searches**.
3. Click the **Recent** tab, locate the search that you want to run, and click it.
The parameters in the recent search override any trace or span information
in the current **Query builder**.
## Save frequent searches
If you find that you're accessing a recent search frequently, you can save the search
so that it's always available to you. Saved searches are like bookmarks that you can
reference whenever you need them.
To save a search:
1. In the navigation menu select
** Explorers > Trace Explorer**.
2. Define the criteria of your search.
3. Click **Save search**.
4. In the **Save search** panel, enter a name for your search.
5. Click **Save**.
To view your saved search, click **View searches**. Your saved search displays in the
**Saved** tab.
To share your search, click **Copy URL** to copy a short URL
to your clipboard that you can share with other users.