> ## Documentation Index
> Fetch the complete documentation index at: https://docs.chronosphere.io/llms.txt
> Use this file to discover all available pages before exploring further.
# Trace Explorer features overview
Trace Explorer includes the following features.
## Span statistics
The charts on the **Span statistics** tab provide summaries of key information about
spans within the trace set that match the current search criteria.
This section aggregates and groups the top service values by their requests, error
count, and duration (or latency). The default display groups statistics by service.
You can [group and narrow results](/investigate/querying/traces#group-and-narrow-results)
by up to three different attributes, which can include service, operation, and tags.
For example, you can select a service like **frontend** and also include a tag like
**deployment.environment** to display your spans with these attributes grouped
together.
Select the **Only critical path** toggle to only analyze spans that most impact the
total duration of a trace, and display them grouped by the selected property. These
attributes help to identify latency issues within the trace.
Click any item in one of the provided lists to include or exclude that grouping in
the current results. Each of the following statistics update dynamically based on your
choices:
The *Trends* view visualizes how trace statistics change over time. Use this view
to better understand the state of your services and how requests and errors change in
a specified time period.
Choose one of the following options from the **Metric** dropdown to update the bar
charts and trends charts:
* **Requests**: Counts of all spans within the selected group, divided by the number
of seconds in the time range. Listed in descending order.
* **Errors**: The number of spans that indicate an error outcome. Listed in
descending order.
* **Leaf errors**: Error spans that have no failing child spans. These spans are
often a potential cause of a trace's failure. Navigating directly to leaf errors
helps filter out propagated errors, and provides clearer signals about the source
of an error that might be causing the entire trace to fail. Listed in descending
order.
* **Median duration P50**: Lists the spans of each group in order of duration, and
selects the duration of the span in the middle of the list (fiftieth percentile).
Lists groups in descending order of this duration.
* **Tail duration P99**: *Tail* refers to the statistical notion of the upper tail of
a distribution. This statistic lists the spans of each group in order of duration,
and selects the duration of the span that's 99% of the way through the list,
meaning, a span that typically has a high duration. Lists service and operation in
descending order of this duration.
The default setting compares the current requests against trace data from one hour
prior. You can also compare current requests or errors against a defined time in the
past. This comparison helps answer questions like, "How do requests to the
**frontend** service in this production environment differ between now and one hour
ago?" To change the comparison, select a time period in the **Compare against**
field, which updates the sparkline graphs.
The **Immediately before** option compares the value you set in the **Time Window**
to a time period of the same length that begins before the current time. For example,
you might choose a time period within the past 30 minutes, which begins on
`11:52:30AM`. Choosing **Immediately before** compares the 30-minute window starting
on `11:52:30AM` to a 30-minute period starting on `11:22:30AM` (exactly 30 minutes
prior).
To modify the displayed data, select one of the following items from the **Metric**
menu. The sparkline graphs update for each row based on the selected metric and the
data groupings you select in the **Group By** menu.
You must select at least one attribute in the **Group By** menu to display data.
The **Aggregate** view displays bar charts for each of the following statistics.
Click any item in one of the provided lists to include or exclude that grouping in
the current results. Each of these statistics update dynamically based on your
choices:
* **Requests**: Counts of all spans within the selected group, divided by the number
of seconds in the time range. Listed in descending order.
* **Errors**: The number of spans that indicate an error outcome. Listed in
descending order.
* **Median duration P50**: Ranks the spans of each group in order of duration, and
selects the duration of the span in the middle of the list (fiftieth percentile).
Ranks groups in descending order of this duration.
* **Tail duration P99**: *Tail* refers to the statistical notion of the upper tail of
a distribution. This statistic ranks the spans of each group in order of duration,
and selects the duration of the span that's 99% of the way through the list,
meaning, a span that typically has a high duration. Ranks service and operation in
descending order of this duration.
## Differential diagnosis
The **Differential Diagnosis (DDx)** tab lets you identify trends and immediately
scan through all related tags and values to pinpoint the exact `tag:value` pairs most
closely correlated with suspicious behavior. This information helps you understand
what issue is causing your app to fail or experience latency.
Select a service, or a combination of a service and a related operation to show the
distribution of `tag:value` pairs across several metrics simultaneously. For example,
you can select a specific service and operation to see which cloud region is
experiencing the highest concentration of errors. Then, select tags relating to
specific software versions to help identify which versions are causing latency in the
selected service and operation.
Use these insights to find issues correlated with negative behavior, such as error
spans or slow spans, which aren't present in successful or fast spans that relate to
optimal behavior.
To help expose trends within smaller subsets of operations, narrow your search over a
specific time. For example, narrow the scope of your search to the last five minutes
and add tags to compare results across related tags. This capability can expose
trends such as a spike in error spans related to a particular environment, Kubernetes
cluster, geography, or other tag that's relevant to your area of the organization.
See [Identify issues behind suspicious trends](/investigate/analyze/differential-diagnosis/traces)
for more information about how to use Differential Diagnosis in Trace Explorer.
### Differential diagnosis metrics
When you choose a service or combination of service and operation, the
**Differential diagnosis (DDx)** tab displays the following data panels:
* **Successful spans**: Spans for the selected service or service and operation that
completed successfully without errors.
* **Error spans**: Spans for the selected service or service and operation that
didn't complete or contained errors.
* **P50 duration**: Spans with the selected tags in the fiftieth percentile of
duration.
* **P99 duration**: Spans with the selected tags in the ninety-ninth percentile of
duration. The spans with these tags typically have a high duration.
* **Cumulative duration**: Spans with the highest cumulative time spent in the
selected time window, across all spans for a specific `tag:value` pair. If a tag
repeats across multiple spans in your search, this statistic displays the sum of
all durations. This statistic can help identify issues that, if resolved, can
result in faster trace duration.
Use the **Chart sorting** dropdown to sync the order of all the bars in other charts
to a specific chart. For example, if you choose **Sync to error spans**, each of the
charts update to reflect the ordering of the **Error spans** chart. This capability
lets you compare the same tag across different heuristics.
#### Interpret metrics
Tag distributions display as a percentage of the total spans in each panel. For
example, you could select a service and operation in the
**Differential Diagnosis (DDx)** tab that results in 100,000 spans.
Out of that total, 42,000 spans display in the **Error spans** panel, and 58,000
spans display in the **Successful spans** panel. If the tag
`environment=stress-test-1` shows that it's in 90% of error spans and 10% of
successful spans, it means this tag is present in 90% of the 42,000 error spans
(37,800 spans), but only 10% of the 58,000 successful spans (5,800 spans).
This information shows that the selected tag is more correlated with errors, which is
likely an indication of underlying issues that require investigation.
## Trace list
After defining your search, the **Trace list** tab displays a list of the most relevant
traces for the search along with the duration, spans, and error states of spans.
To download an individual trace in OpenTelemetry Protocol (OTLP) JSON format, click
the three vertical dots icon and select
**Download JSON**. Alternatively, use the
[ListTraces](/tooling/api-info/data_definition/operations/ListTraces) endpoint
to return a list of traces in OTLP JSON format.
Select an individual trace to open the trace details page. The header displays
details at both the root level and span level. The root level details encompass all
spans contained in the trace. The span level details show data that's scoped to the
selected span only. Selecting a different span in the list won't change the root
level details, but the span level details update to reflect information about the
selected trace.
The trace details include the service name, operation name, trace ID or span ID,
start time, duration, and additional statistics for the trace at the root and span
level. Use the quick copy button to copy the service
name, operation name, and span ID. You can take that data to the Trace Explorer page
to include in your overall search.
### Narrow displayed data
After selecting an individual trace from the **Trace list** tab, you can use the
following options to narrow the displayed data:
* Use the column menus to scope spans to specific criteria, which defaults to
**Service** and **Operation**. Selecting a different attribute updates the entire
column, so selecting a tag like `build.version` changes the selected column to
display values for that attribute.
These menus let you search through a specific trace to find matches for
individual spans based on different attributes, which can help when debugging
issues in a specific trace.
Select one of the following options from either menu:
* **Service**: the individual service to match on.
* **Operation**: the operation to match on.
* **Span kind**: the
[`SpanKind`](https://opentelemetry.io/docs/specs/otel/trace/api/#spankind)
to match on. This property helps identify whether a span represents a call to an
outgoing service or a request/response operation.
* **Span logs**: identifies spans with logs attached to them.
* **External parents**: identifies spans with linked parent spans within a trace.
* Tags: individual tags that you want to match on, such as `k8s.container.name`.
* Use the **Only errors** toggle to display only segments of each trace that contain
errors.
* Use the **Only critical path** toggle to highlight spans that impact
the total duration of a trace. These segments help to identify latency issues within
the trace.
### Filter displayed data
You can additionally filter results to only the criteria you select. Available
criteria, such as service, operation, and tag, are scoped to the current query
results only.
* Use the **Filter by service, operation, duration, span kind, or external parent**
menu to filter search results to a selected label/value pair. Click the box to
display the label/value matching criteria.
* Use the **Filter by tag or process** menu to filter search results to a specific
tag or process.
### Navigate to specific spans
You can choose options from the span navigation bar to jump to specific spans that
can help with error and issue detection:
* **Errors**: Spans that end with an error.
* **Critical path**: Spans that contribute to the overall duration of the trace.
* **Span logs**: Spans logs are unique to a trace, and indicate events, process
status within a span, or other instrumentation data.
* **N+1 s**: A series of spans with the same parent span that contain repeat
attributes for selected search facets, and have no overlap in time range. These
spans can help when debugging slow traces or traces that time out.
* **Leaf errors**: Error spans that have no failing child spans. These spans are
often the potential cause of a trace's failure. Navigating directly to leaf errors
helps filter out propagated errors, and provides clearer signals about the source
of an error that might be causing the entire trace to fail.
* **Slowest leaf spans**: The slowest spans with no child spans, encompassing the
ninety-fifth percentile of all spans.
### Span details
Select an individual span from the list to display its **Span details**, which
include the following information about the span. Choose **Formatted** (default) to
display a tabular view, or **Raw** to view span details in JSON format.
In some instances, a trace might contain a missing span. Chronosphere Observability
Platform identifies these spans for the selected trace as **\** in the
**Span details** panel.
To search for traces containing a missing span:
1. Go to the **Custom tags** field in the **Query builder** of
[Trace Explorer](/investigate/querying/traces).
2. Enter `parent_missing` as the label to match.
3. Enter `true` as the value.
Identifying missing spans can help you fix instrumentation issues or drop
non-critical traces containing missing spans.
* **Analyze span with DDx** opens the [**Differential Diagnosis (DDx)**](#differential-diagnosis)
tab with the context from the selected span. This tab lets you identify trends and
immediately scan through all related tags and values to pinpoint the exact
`tag:value` pairs most closely correlated with suspicious behavior.
* **Span topology map** opens a drawer with an alternate view of the span data,
scoped to the span you're viewing. If you enter this view from any span, the map
visualizes only that span and its child spans. View the data scoped by service or
by operation to change the data map. This map visualizes the requests in a tree
format, with the width of the lines representing the relative number of spans going
from each node to each child node.
This view is helpful when a trace has a large number of spans, which is difficult
to scroll and understand in the waterfall view. This scoped view summarizes the
overall shape of the data in a single screen, which simplifies understanding the
flow of data between each service and operation.
* **Links** to external services, such as related tracing logs stored in your cloud
provider, or links to other observability tools. You can dynamically generate links
to external services using templated variables, such as `{{ trace_id }}`. Click
**+ Add Link** to add a link.
* **Metadata** for the span, including the span ID, start time, and duration. Child
spans have a **Parent span ID** field that indicates parent spans. Hold the
pointer over the parent span ID, click the three
vertical dots icon, and then click **Go to span** to navigate directly to the parent
span.
A child span can have multiple parent spans, such as when a batch operation runs
multiple jobs that it receives from other operations. If a span in the selected
trace has more than one linked parent, both parent span IDs display. You can
navigate directly to the parent span you want to view. Because linked operations
might complete asynchronously, the linked trace process might not be immediately
available and can take several minutes to display.
* **Tags** attached to a trace. Point to any tag and select the more icon
to add or exclude that tag from your span filter.
* **Process** tags that are common to a set of traces. Point to any tag and select
the three vertical dots icon to add or exclude that
tag from your span filter.
* **Span logs** are unique to a trace, and indicate events, process status
within a span, or other instrumentation data.
When you select a trace, the name of a trace to view the included service,
operation, and any errors, which display with a red error symbol. When you
choose a service and operation, the span details update with the following
information:
### Sorting results
By default, the list sorts results by **Start time** in descending order. You can
sort the results by any column in ascending or descending order by clicking the arrow
that appears when holding the pointer over the text of the column heading.
Hold the pointer over the far end of each column heading to display the
three vertical dots icon. This menu provides access
to advanced sorting and filtering options and lets you reverse the sorting order,
filter values, and hide and show columns.
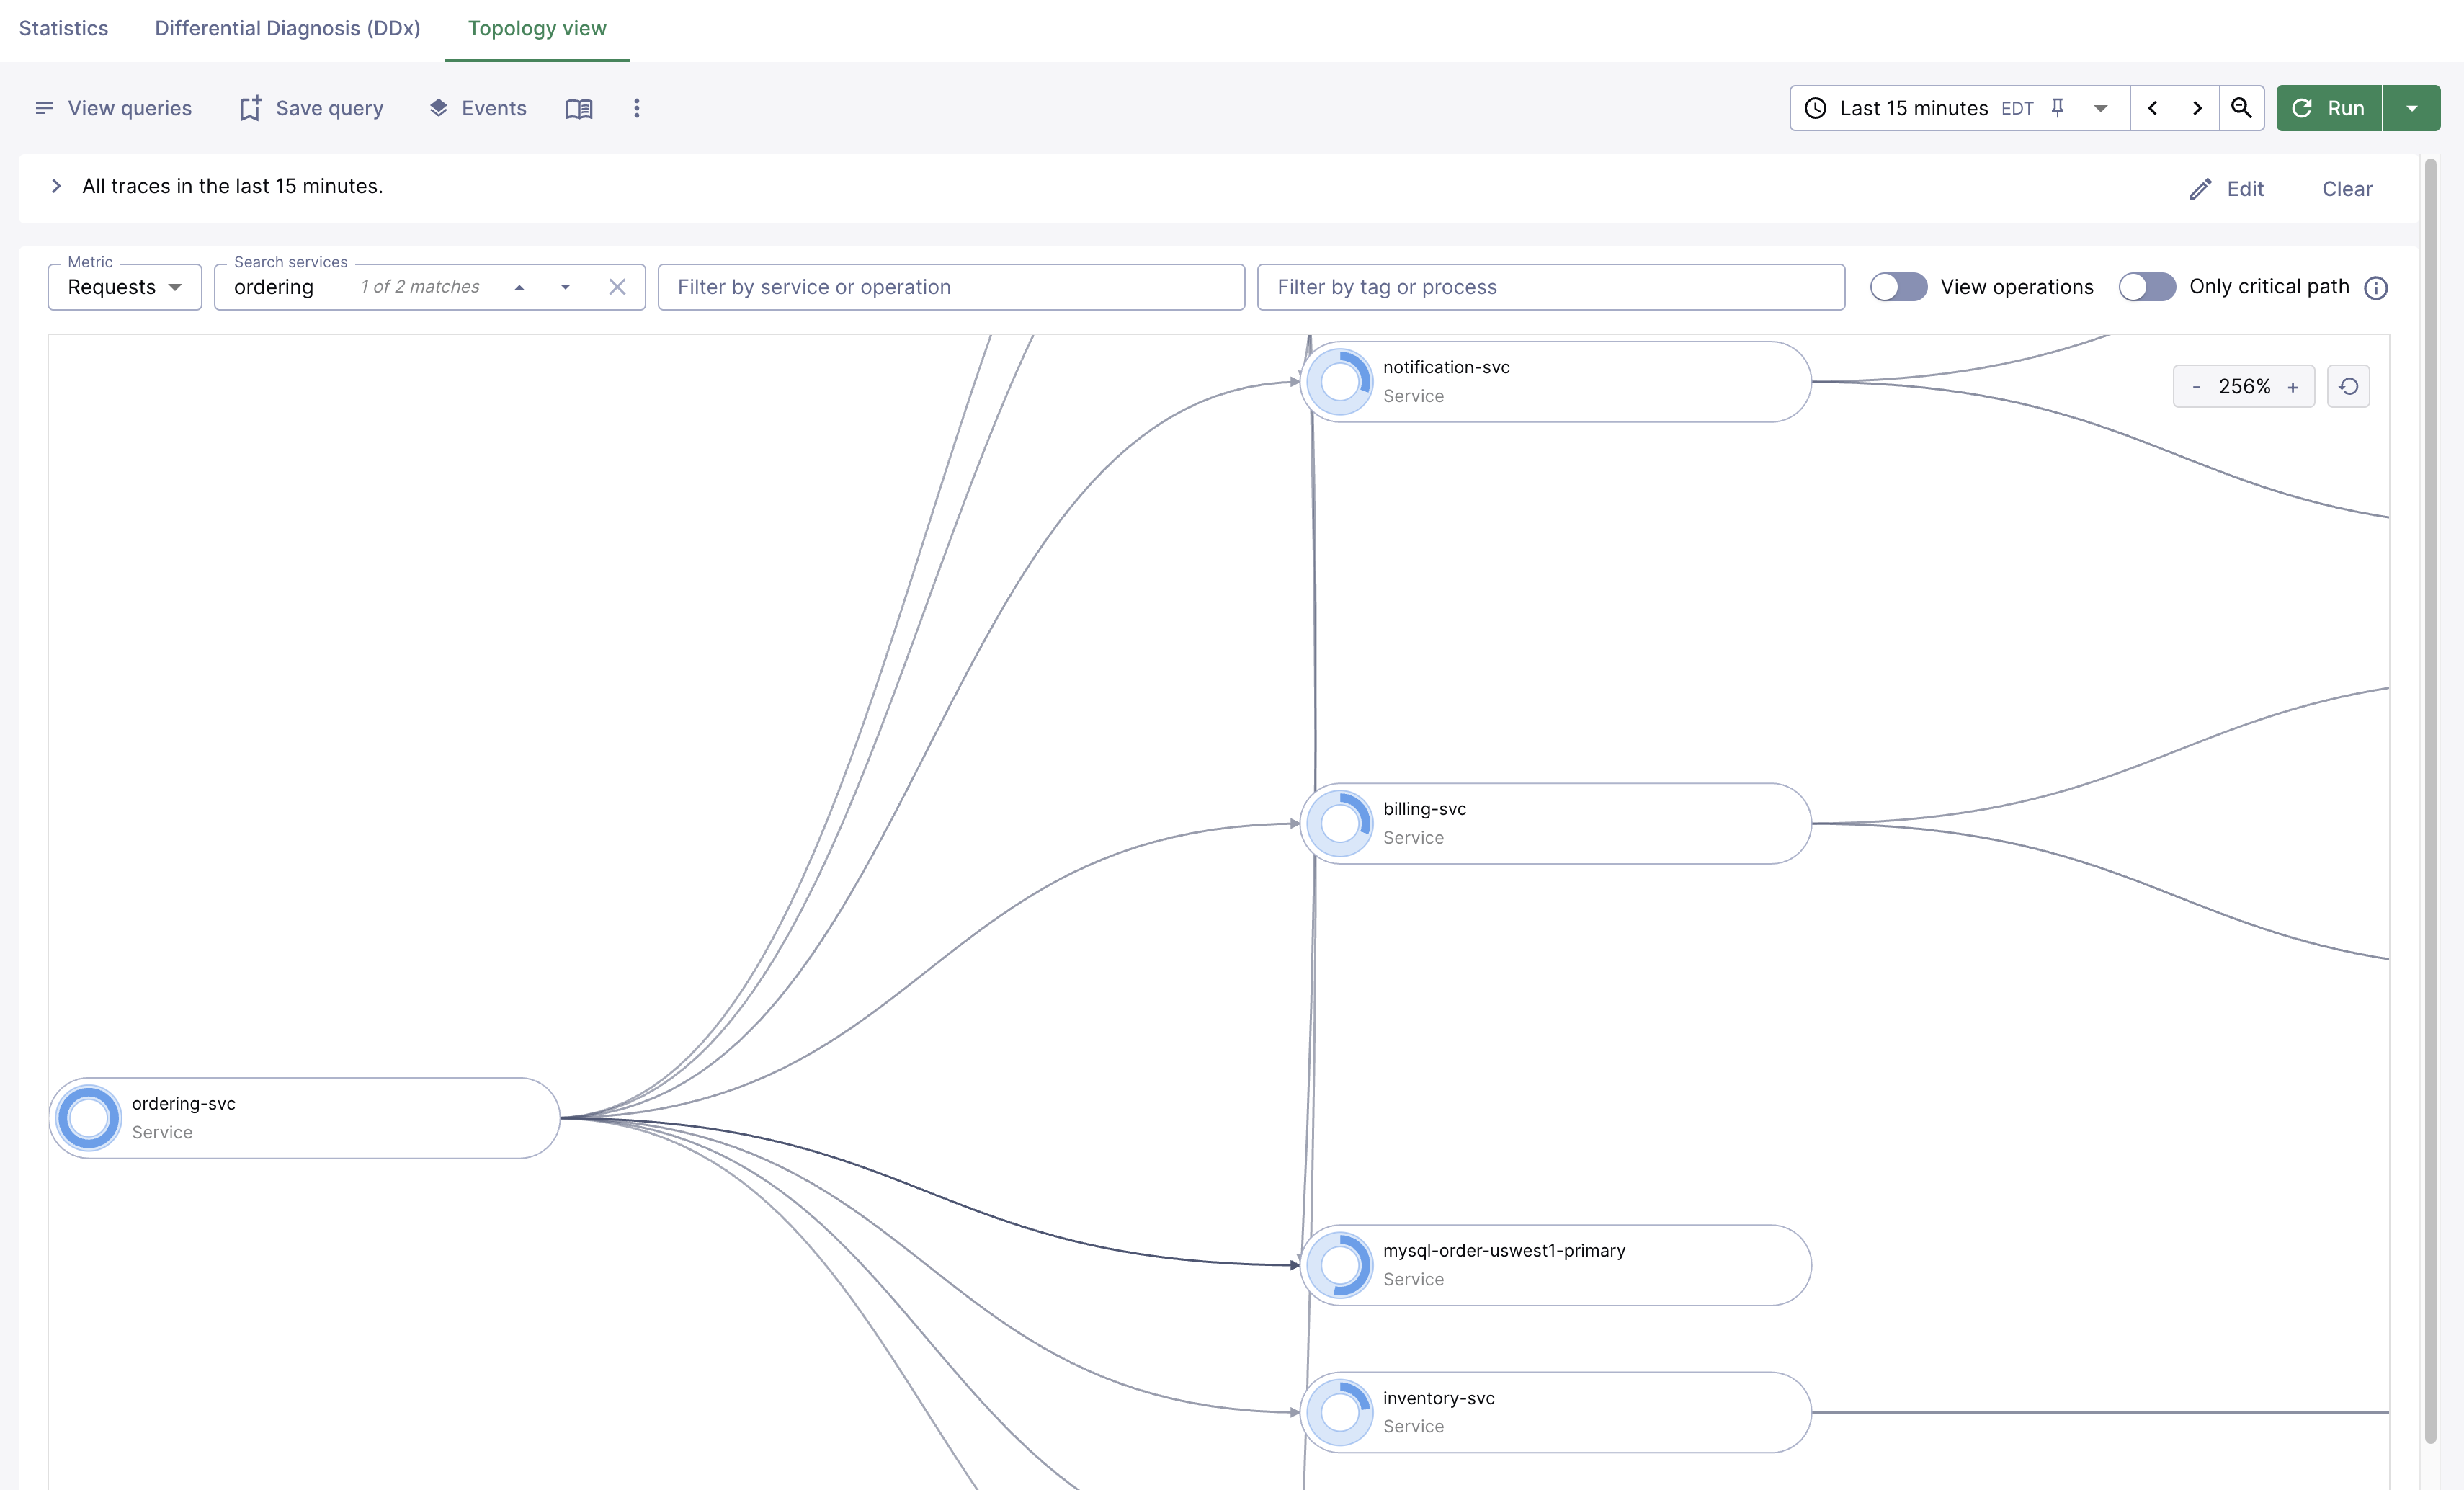
## Topology view
Use the topology view to visualize how traces from services and operations in the
current search results cascade from each other.
You can access the topology view from either Trace Explorer or from the
[dependency map](/observe/services/service-pages#understand-trends) of an individual
service page. The scope of the dependency map in a service page is specific to the
selected service. Click **View full map** to open the topology view in Trace Explorer,
scoped to the selected service.
To narrow the scope of the topology map, search for services, filter by operations,
and filter by tag or process. Use the **Metric** list to change which metric the
topology view displays. To search for specific services, use the **Search services**
field.
Select the **Only critical path** toggle to highlight segments of each span that
impact the total duration of a trace. These segments help to identify latency issues
within the trace.
Hold the pointer over one of the service or operation nodes to highlight the other
nodes directly connected to it. Hold the pointer over a segment connecting one or
more nodes to highlight the nodes directly connected to the segment.
Click any node to display node details, such as incoming and outgoing requests, and
the median and tail duration of related spans. With a node selected, click
**Include** or **Exclude** to include or exclude the selected service or operation in
your **Span characteristics**.
Edges, which are lines between services, provide details about connected services.
Click an edge to view the requests and trace duration between two services.