> ## Documentation Index
> Fetch the complete documentation index at: https://docs.chronosphere.io/llms.txt
> Use this file to discover all available pages before exploring further.
# Navigate the Observability Platform interface
export const ServiceNavIcon = props => {
return ;
};
export const CollectionNavIcon = props => {
const drawPath = "M8.4 18.2C8.8 18.7 9 19.3 9 20C9 21.7 7.7 23 6 23S3 21.7 3 20 4.3 17 6 17C6.4 17 6.8 17.1 7.2 17.3L8.6 15.5C7.7 14.5 7.3 13.1 7.5 11.8L5.5 11.1C5 11.9 4.1 12.5 3 12.5C1.3 12.5 0 11.2 0 9.5S1.3 6.5 3 6.5 6 7.8 6 9.5V9.7L8 10.4C8.6 9.2 9.8 8.3 11.2 8.1V5.9C10 5.6 9 4.4 9 3C9 1.3 10.3 0 12 0S15 1.3 15 3C15 4.4 14 5.6 12.8 5.9V8.1C14.2 8.3 15.4 9.2 16 10.4L18 9.7V9.5C18 7.8 19.3 6.5 21 6.5S24 7.8 24 9.5 22.7 12.5 21 12.5C19.9 12.5 19 11.9 18.5 11.1L16.5 11.8C16.7 13.1 16.3 14.5 15.4 15.5L16.8 17.3C17.2 17.1 17.6 17 18 17C19.7 17 21 18.3 21 20S19.7 23 18 23 15 21.7 15 20C15 19.3 15.2 18.7 15.6 18.2L14.2 16.4C12.8 17.2 11.2 17.2 9.8 16.4L8.4 18.2Z";
return ;
};
The Chronosphere Observability Platform user interface guides you to the resources
you need.
## Personal home page
After you sign in, Observability Platform displays your personal
[home page](/observe/personal-homepage).
You can [customize](/observe/personal-homepage#customize-your-home-page) this
home page to display the information you need the most.
To return to the home page from anywhere in Observability Platform, click the
Chronosphere icon at the top of the navigation menu.
## Team and collection home pages
Teams and collections have their own *home pages* populated with links to associated
resources, and also customizable links and descriptions. For details, see
[Team and collection home pages](/administer/collections/home).
## Search
Observability Platform provides a global search bar on every page that supports
searching for teams, collections, dashboards, monitors, services, and SLOs by name.
To search, click the search bar or use the keyboard shortcut `Control+K`
(`Command+K` on macOS) to focus on the bar, and then begin typing. Search
results will appear as you type.
By default, search results include all supported resource types. To toggle a resource
type's visibility in the results, click its selector at the top of the results list.
The icons in the resource type filters correspond to the icons displayed next to
each result and identify each result's type. Resources in the results that belong
to a team or collection also list them beneath the result's name.
## Your account
The interface represents your signed-in account by your first initial in a circle.
Click your account to open a panel to:
* Select your UI theme.
* Select the **Time zone** your account uses to display data.
* Choose your **Clock** display preference: **12-hour** or **24-hour**.
* Open the **My Account** page, which contains details about your account and your
[personal access tokens](/administer/accounts-teams/personal-access-tokens).
* **Sign Out** of Observability Platform.
* Confirm your signed-in account's email address and the Observability Platform
version number.
## Help and documentation
Click **** to open a panel containing links to
these resources:
* The contextual link for the current page's documentation
* Product documentation
* [Support portal](https://support.chronosphere.io)
* [Keyboard shortcuts](#keyboard-shortcuts)
## Feature navigation
The navigation menu contains links to each of its toolsets and functions:
All users:
* ** System Overview** links to tools to explore services and
service level objectives (SLOs).
* ** Collections** opens a panel with links to home pages for each team and
collection, and a link to your personal home page.
* ** Dashboards** opens the list of all dashboards.
* ** Alerting** links to tools related to monitors, alerts, and notifications.
* ** Explorers** links to tools to explore metrics, traces,
logs, and change events.
Administrators only:
* ** License Overview**
opens a page with details about your license usage.
* ** Analyzers** links to metric and query analysis tools.
* ** Control** links to metric and trace management tools.
* ** Platform** links to administrative tools and
maintenance views.
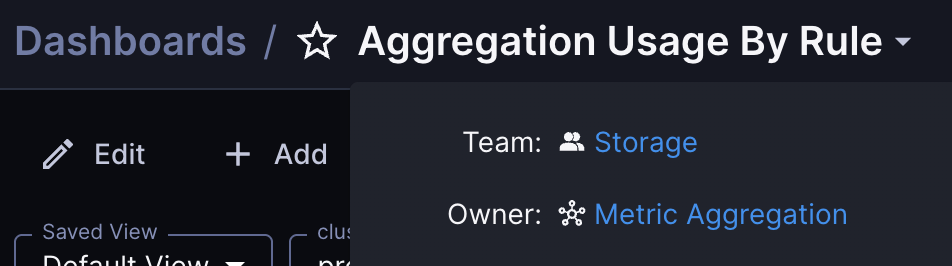
## Header navigation
[Dashboards](/observe/dashboards), [service pages](/observe/services/service-pages),
and [SLOs](/observe/slo) in Observability Platform have a header that displays
[team ownership](/administer/accounts-teams/teams) and the
[collection or service that owns](/observe/dashboards#create-a-new-dashboard) the displayed
resource. The header also enables searching for other resources owned by the same
team or collection.
1. In the navigation menu, select either **Dashboards**, **Services**, or **SLOs**.
2. Click a dashboard, service, or SLO from the table.
3. Click the dashboard or service name to display the header overview.
You can click the team, service, or collection name to go to its overview page.
## Shareable links
Many pages in Observability Platform include a **Copy URL**
button in the page header. Click it to copy a shareable URL for the current page or
view to your clipboard, and then share it with teammates so they can open the same
context directly.
Some pages generate a compressed short URL instead, because their query state can
produce long URLs. This includes Logs Explorer, Trace Explorer, and Metrics Explorer.
When a query matches one that was previously shortened, the existing short URL is reused.
## Notebooks
[Notebooks](/navigate/notebooks) open in a side panel so you can gather panels,
resource links, and notes from multiple pages while you troubleshoot. Click **Notebook**
in the page header or right sidebar to open your last notebook.
## Keyboard shortcuts
Many pages in Observability Platform include keyboard shortcuts. Press
`Control+/` (`Command+/` on macOS) to display the shortcuts for a
page. Not all pages include shortcuts.
## Mobile-friendly pages
Some pages in Observability Platform have been optimized for use on cell phones and
other mobile devices. Mobile-friendly pages include Monitors, Dashboards, Services,
SLOs, Collections, and Teams.
## Chips
Observability Platform uses [chips](https://m2.material.io/components/chips)
in the web app. Chips are generally used as filters to narrow down the scope of
searches or queries. [Pinned scopes](/navigate/pinned-scopes) and
[search](#search) are two examples of pages using chips.
If a chip has a close icon, you can click the icon to
remove the chip. Chips without a close icon are pinned scopes that can be deactivated
or reactivated by clicking the chip.
## Feedback
If you have feedback on Observability Platform, click ** Feedback**.
## More information
Click the ** More information** menu to open a panel containing
links to these resources:
* [**Chronosphere University**](https://learn.chronosphere.io/) for training courses.
* **Chronosphere status**: View the Chronosphere service status page.
* **Release Notes**: View product release notes for Observability Platform, Chronosphere Collector,
Chronoctl, or the Chronosphere Terraform provider.
* **Privacy Policy**: View the [Chronosphere Privacy Notice](https://chronosphere.io/privacy/).
 You can click the team, service, or collection name to go to its overview page.
## Shareable links
Many pages in Observability Platform include a
You can click the team, service, or collection name to go to its overview page.
## Shareable links
Many pages in Observability Platform include a 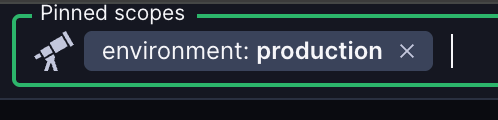 If a chip has a