> ## Documentation Index
> Fetch the complete documentation index at: https://docs.chronosphere.io/llms.txt
> Use this file to discover all available pages before exploring further.
# Classic dashboards
Chronosphere integrates two types of dashboards:
* Standard dashboards, documented in [Dashboards](/observe/dashboards).
* Older, "classic" dashboards based on Grafana, documented here.
Classic dashboards don't receive new features or performance improvements, while
standard dashboards are being actively improved and are better integrated with
Chronosphere interface and data sources.
Classic dashboard API endpoints are not available for organizations on standard
dashboards. Requests to these endpoints return an error. To manage dashboards
programmatically in these environments, use the
[standard dashboard](/observe/dashboards) endpoints. For information
about your organization's dashboard configuration, contact
[Chronosphere Support](/support).
## Create a classic dashboard
To create a new dashboard:
1. In the navigation menu select **Dashboards**.
2. Click **+ Add**.
3. In the menu that appears, click **New dashboard** to open the **Add dashboard**
dialog.
4. Click **Classic**.
5. Enter a descriptive name in the **Dashboard name** field.
6. Enter an **Owner** in the corresponding field to associate the dashboard
with a [collection](/administer/collections) or [service](/observe/services).
7. Optional: Enter **Tags** in the corresponding field to associate the dashboard
with key/value tag pairs.
8. Click **Save**.
You can also [import a Grafana dashboard](/observe/dashboards/classic-dashboards/grafana-import)
or [define them in YAML](/observe/dashboards/classic-dashboards/classic-panels#add-panels-to-a-dashboard)
with Chronoctl.
## Delete a classic dashboard
Users can modify Terraform-managed resources only by using Terraform.
[Learn more](/tooling/infrastructure/terraform#prevent-changes-to-managed-resources).
To delete a classic dashboard:
1. In the navigation menu select **Dashboards**.
2. Open the dashboard you want to delete.
3. Click **Settings**.
4. Click **General settings**.
5. Click **Delete dashboard**.
To delete a dashboard with [Chronoctl](/tooling/chronoctl), use
the `classic-dashboards delete` command, passing in the classic dashboard's slug.
```shell theme={null}
chronoctl classic-dashboards delete
```
To delete a dashboard using [Terraform](/tooling/infrastructure/terraform), remove
its definition from the Terraform file and rerun `terraform apply`.
## General settings
The **General settings** dialog presents fields to edit the dashboard's
name, its associated collection, and any applied labels.
You can also delete the dashboard by clicking the delete icon.
## Classic settings
To configure settings specific to classic dashboards, click **Settings**, then click
**Advanced settings**. This view organizes classic dashboard settings into several
tabs.
### General
The **General** tab (accessed from the navigation menu by selecting
**Advanced settings > General**)
contains:
* **Time Options**: Per-dashboard time settings. For details, see the
[Grafana documentation](https://grafana.com/docs/grafana/v7.5/dashboards/time-range-controls/#dashboard-time-settings).
* **Annotations**: Add and manage [annotations](#annotations) to points on dashboard
graphs. For details, see the
[Grafana documentation](https://grafana.com/docs/grafana/v7.5/dashboards/annotations/).
* **Variables**: Add and manage dynamic values to your dashboard. For details, see
the [Grafana documentation](https://grafana.com/docs/grafana/v7.5/variables/syntax/).
* **Links**: Add and manage links to other dashboards and external URLs.
* **Versions**: View, compare, and restore previously saved versions of the dashboard.
* **JSON Model**: Change and export the dashboard's Grafana JSON model. For details,
see the [Grafana documentation](https://grafana.com/docs/grafana/v7.5/dashboards/json-model/).
#### Annotations
Use annotations to overlay system events on top of dashboards. For details, see
the [Grafana documentation](https://grafana.com/docs/grafana/v7.5/dashboards/annotations/).
You can add annotations manually or automatically using a query expression. To use
a query to automatically add annotations, first determine that an event you want
to track emits a metric.
For example, to overlay deployments, you can ingest a metric that tracks deployments
into the Chronosphere platform. To use the Kubernetes metric `kube_deployment_metadata_generation`
to automatically add deployment events from the `gateway` service as annotations
on graphs, set these values for the annotation's fields:
* **Name**: `Gateway deployments`
* **Data source**: `Chronosphere Prometheus` (Use `Chronosphere Graphite` if using
Graphite metrics)
* **Search expression**:
```text theme={null}
increase(kube_deployment_metadata_generation{chronosphere_k8s_cluster="$cluster",namespace="$namespace",deployment="gateway"}[5m])
> 0
```
This is a gauge metric with only two values: `1` when the service deploys, or
`0` when there's no change in the deployment status. Adding `> 0` to the search
expression adds the annotation only to deployments.
* **Title**: `Gateway deploys`
* **Tags**: `chronosphere_k8s_cluster,deployment`
These can come from variables set in the **Variables** section or from labels
returned by the query.
* **Text**: `gateway deployed in {{namespace}}`
To use variables, wrap the variable name in double curly brackets (`{{ }}`).
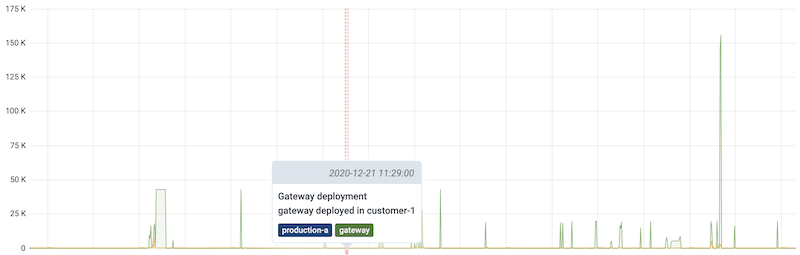
Based on these settings, this is how the annotations looks:
 To add alerts as annotations, use the special `ALERTS` metric. For details, see
the [alert metrics](/investigate/querying/metrics/alert-metrics).
To add alerts as annotations, use the special `ALERTS` metric. For details, see
the [alert metrics](/investigate/querying/metrics/alert-metrics).