

Standard Metrics License
The Standard Metrics License measures aggregations, persisted writes, and persisted cardinality license consumption for the following Observability Platform metric types:- Cumulative counter
- Delta counter
- Gauge
Because Observability Platform aggregates and persists legacy Prometheus histograms
and OpenTelemetry explicit bucket layout histograms as cumulative or delta counters,
these metrics consume Standard Metrics License capacity.
Histogram Metrics License
The Observability Platform histogram metric type supports both OpenTelemetry exponential histograms and Prometheus native histograms. The Histogram Metrics License measures aggregations, persisted writes, and persisted cardinality license consumption for the following Observability Platform metric types:- Cumulative exponential histogram
- Delta exponential histogram
Capacity license metrics
The following metrics apply in a capacity licensing model.Matched writes
Matched writes are the number of writes per second being matched for transformation and reshaping by the Observability Platform aggregation tier. A matched write is counted for each data point matched into each aggregator rule, whether rollup or downsampling. If a data point matches one rule, that’s one matched write. If a data point matches two rules, that’s two matched writes. The sum of the matched data points per second per rule equals the total matched writes. Recording rules aren’t considered an aggregation rule for the purpose of counting matched writes. Writes also depend on your Collector scrape interval. Increasing the scrape interval produces fewer writes, but can reduce visibility. See your current Matched Writes level in the License Overview Snapshot in the Metrics Consumption section. On the Trends page, review usage over time in the Metrics Consumption Trends graph.Matched writes metrics
The following metrics apply to matched writes, which are the number of writes per second being matched for transformation and reshaping by the Observability Platform aggregation tier.
Query the following metric to understand if data is actively being dropped:
Persisted writes
The number of persisted writes to the Observability Platform database consists of the following:Persisted writes metrics
The following metrics apply to persisted writes.
For each of these metrics, you can query by
datapoint_type, such as histogram or
standard. For the _dpps_capacity and _dpps_consumed metrics, you can
additionally query by pool_name, and priority.
For example, the following query returns the consumption rate in DPPS of your
persisted write license for histogram data points on the Auth Services pool.
Because priority isn’t specified, the query returns a series for each priority:
Auth Services pool, specify priority = "high" in your query:
Persisted cardinality
Matched writes and persisted writes measure the rate of data points per second at any given moment in time. Persisted cardinality operates differently, because it’s a cumulative measure that calculates the count of the unique time series of the persisted writes that Observability Platform stores, seen over the last 2.5 hours. This measure is also known as Active Time Series (ATS). Persisted cardinality can be influenced by a change in ingested metrics, or you can use rollup rules to downsample and aggregate metrics before they’re stored. Because this measure is cumulative, reductions in persisted cardinality aren’t reflected immediately, as inactive time series continue counting until they fall outside the 2.5 hour rolling window. Read more about persisted cardinality limits work and how to manage them:- Learn how persisted cardinality limits work
- Manage persisted cardinality limits
- Avoid persisted cardinality limits
Persisted cardinality metrics
The following metrics apply to persisted cardinality.
Query the following metric to understand if data is actively being dropped:
How persisted cardinality limits work
Persisted cardinality is comparable to a leaky bucket. Over time, new series can be added until the bucket is full. When the bucket is at maximum capacity, there’s no space for new time series, so they’re rejected. When existing time series expire, they make room for new series. In the following example, the persisted cardinality capacity is five unique time series. The animated image shows the lifecycle of six, unique time series (A, B, C, D, E, and F) as new data points are added, and as other data points expire.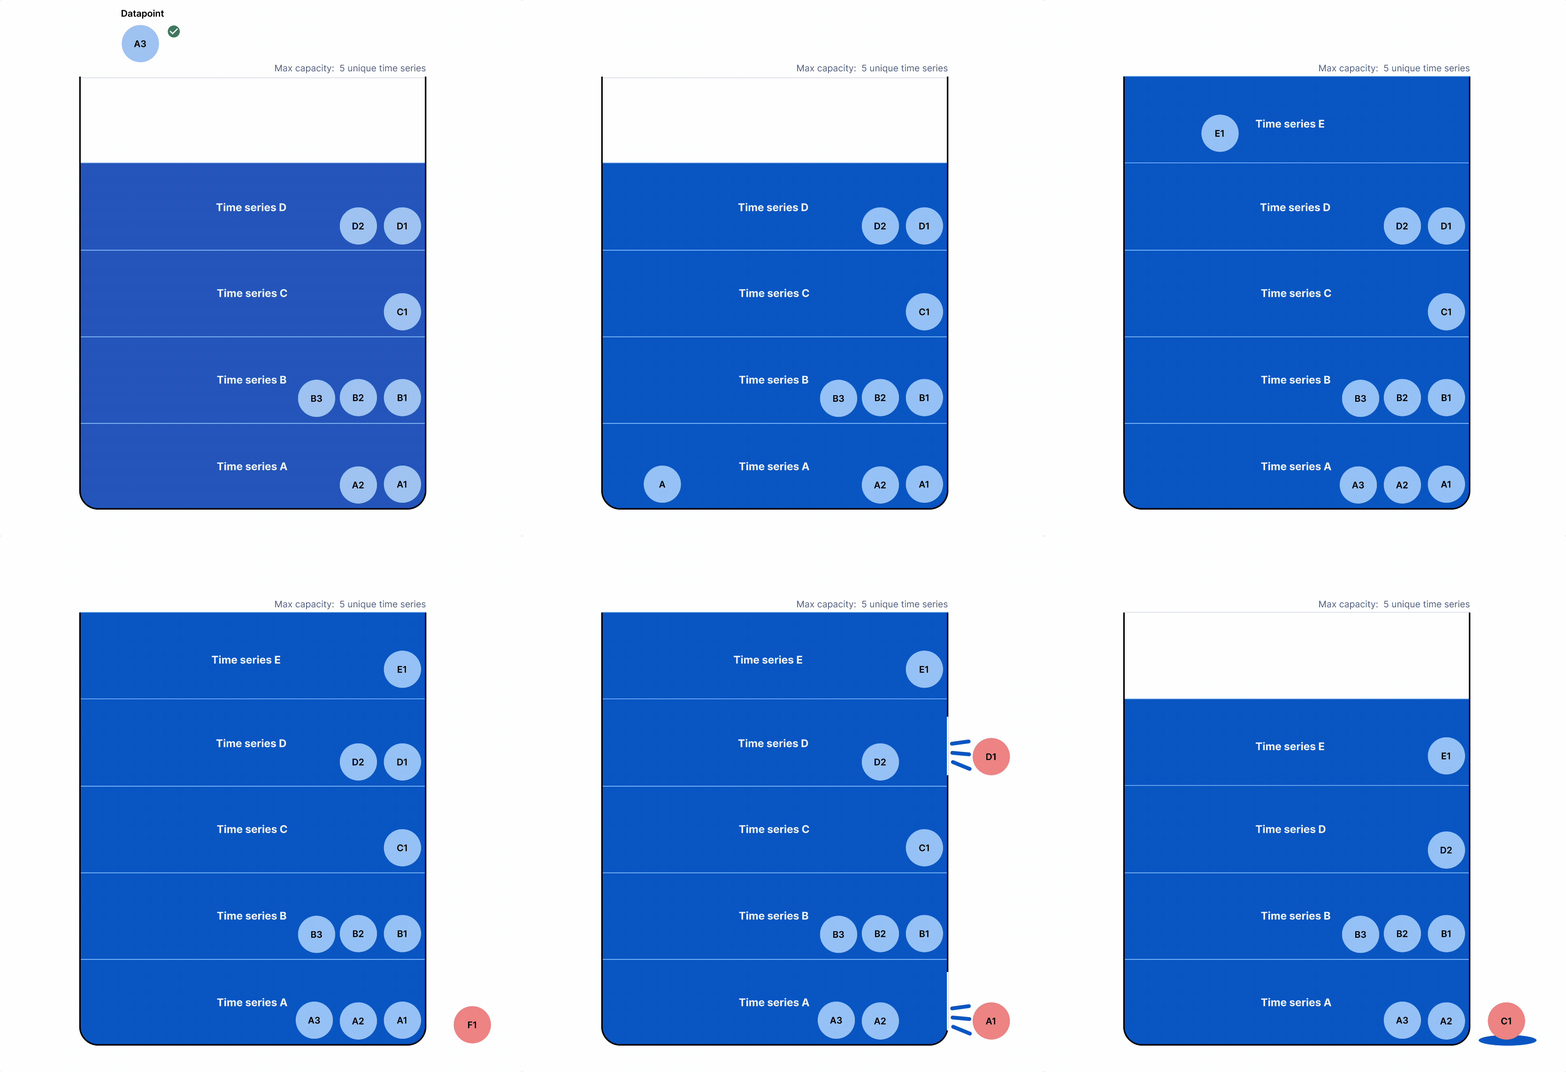
- If the bucket is at maximum capacity and the series already exists, the data point is accepted.
- If the bucket is at maximum capacity and the series doesn’t exist, the series is rejected.
Over time, data points expire based on when they entered the bucket. When data points
exceed the 2.5 hour window, they’re excluded from the persisted cardinality bucket.
In the example, data points A1 and D1 expired, so they’re excluded from the bucket.
When data point C1 expires, it’s also excluded. Because data point C1 is the last
data point in time series C, the entire series is removed, making space for a new
time series in the bucket.
Manage persisted cardinality limits
If your organization exceeds 100% of their Persisted Cardinality Capacity Limit, data points for any new time series not seen in the last 2.5 hours will be dropped until you’re under this limit. Data points for existing time series will continue to be persisted. Series that are more stable or regularly emitted aren’t at risk of being dropped because they’re always in the system, and aren’t categorized as new series. For example, series that don’t change any labels are considered more stable. To fully resolve a penalty period, the rate of new series must be less than the rate of expiring series. The higher the differential between these rates, the faster the penalty resolves. To manage persisted cardinality limits:- Review the Persisted Cardinality Quotas dashboard, the Usage Dashboard and the Metric Growth dashboard to understand the source of cardinality growth.
- Create drop rules and aggregation rules like mapping rules and rollup rules to roll away sources of growth. Old series remain in the cardinality window for 2.5 hrs.
- Use the Recommendations page to help identify metrics and labels with no usage or utility over the past 30 days. You can then create drop rules and rollup rules based on the recommendations.
Avoid persisted cardinality limits
Create thresholds on budgets to help manage both anomalous spikes in data and slow data growth over time. Configure actions on each threshold. Fixed-volume drop thresholds discard all matching data after the limit is exhausted until the window resets. Use the following tools and techniques to avoid hitting persisted cardinality limits:- Review the Persisted Cardinality Quotas dashboard, the Usage Dashboard and the Metric Growth dashboard to understand the source of cardinality growth.
- Learn about different methods to reduce cardinality.
- Proactively create drop rules and aggregation rules like mapping rules and rollup rules ahead of potential overages to evict older time series and make room for new ones.
- Proactively define thresholds on budgets to better manage persisted cardinality.
- If your organization knows which new metrics services are generating, try to control the rate that new series are introduced through smaller, more incremental deploys.
Capacity limits
Capacity limits only apply to capacity pricing. If your organization uses the
consumption model, see Manage consumption.
- Persisted writes
- Matched writes
- Persisted cardinality
- Histogram persisted writes
- Histogram matched writes
- Histogram persisted cardinality
Legacy licensing metrics
The following table explains metrics that might be present in your environment, but will be replaced by new metrics. The following metrics replace this table: These metrics create the following tags during dashboard creation:chronosphere_service