Query protections
Query resources are finite in any given system. Resource demand grows based on factors such as the source of, and the amount of data retrieved by the query.
In Chronosphere, query demand comes from either an automated or a manual source:
- Automated sources, such as recording rules and monitors with regular evaluation intervals, produce a relatively predictable demand on the query resources at the database and at the browser. Automated queries often request a smaller set of data than, for example, a dashboard query, but might recur high volumes. Although each individual query is small, the amount of query resources they're demanding at regular intervals is very large.
- Manual query sources, such as loading a dashboard, running a query in Metrics Explorer, or making a direct API call, place cyclical or spikes of demand on query resources at the database and the browser. Manual queries are often exploratory or are retrieving longer time periods than automated queries. The load these queries place on the system varies significantly with the scale of data returned. Queries requesting more time series and data points require more resources to retrieve information from the database, and also can require more resources to deliver that information to the browser.
Individual queries of either type demand different query resources depending on the amount of data retrieved from the database, amount of data returned the browser, or both. For example:
- A query that places high load on the database but low load on the browser might request the sum of a large set of data. The query retrieves all relevant data points from the database (high database query load) but only returns a few summed data points to the browser for a systems performance monitoring workflow.
- A query that places high load on the database and browser might request the raw, unaggregated data points from all services (many unique time series) to be returned to the browser, such as for a debugging workflow.
Any very large query can request enough resources at either the database or browser level that it leaves few resources for other queries, causing them to time out waiting for resources to become available.
Chronosphere employs several query protection methods at both the browser and the database level to ensure an excellent user experience across the system in response to current query demand.
Optimize queries
Large queries might be good candidates for optimization by decreasing the amount of data the query is trying to retrieve. Use the Query overview dashboard to identify large queries.
Optimize queries by:
- Shortening the time window, or using rollup rules to decrease the data scale.
- Improving the query syntax by removing regular expressions to reduce the index lookups performed by the query.
- Adjusting the number of concurrent unique requests in the system.
Query truncation at the browser
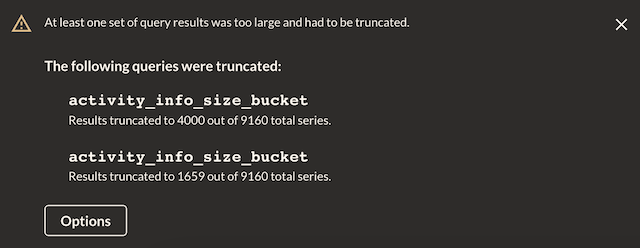
Chronosphere can truncate queries that return many unique time series or data points to the browser to reduce the chances of long load times and query timeouts. Truncating queries protects the browser from crashing when querying many metrics. Dashboards and the Metrics Explorer both use query truncation.
Chronosphere calculates the browser limit using a combination of time series, time granularity, and time period (and their resulting data points) requested by the query.
The current limits are:
- Time series a query can return to the browser: 4,000
- Data points a query can return to the browser: 400,000
The number of time series and data points returned to the browser might be the same as the number requested from the database. If the query is doing some level of aggregation, the number of time series and data points returned might be fewer. They will never be greater.
To reduce the number of series returned to the browser, view the Aggregation Rules UI to determine if a queryable aggregate metric already exists. If an aggregate metric doesn't exist, use aggregation rules or derived metrics to query an aggregated subset of the raw data, or break up the query into smaller chunks (by time, for instance) to reduce returned data points.
Enable or disable query truncation
By default, Chronosphere enables query truncation.
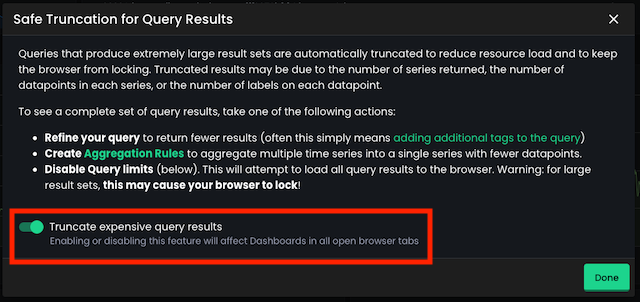
To disable or re-enable query truncation:
- In the displayed dialog, select Options.
- Click the Truncate expensive query results toggle.
- Click Done.
Disabling query truncation causes expensive queries to take longer to load and can result in timeouts (no results returned for a single query), or might cause the browser to crash.
Query protections in the database
Chronosphere employs protections against very large queries in the database layer, in addition to the browser.
A query that requests many unique time series or data points from the database can experience these situations:
- Per-query scale protections
- Across-query resource balancing protections
- Individual query timeouts
These protections ensure a positive user experience for the maximum number of users.
A query requests resources from the database until it has the data it needs, or until resources run out. Available resources can run out due to these reasons:
- Individual query scale protections are in place.
- There are many queries sharing scarce query resources (query balancing).
- An individual query reached a timeout.
Query scale protections
Query scale protections ensure a positive user experience for the maximum number of users. Current database query scale protections are:
- Time series (opens in a new tab) a query can retrieve: 300,000
- Data points a query can retrieve: 200,000,000
The data points needed to satisfy the query's time requirement are the (Number of requested time series) * (Data resolution of the requested time series).
For example, a query does a sum of data points over two minutes, storing the requested
data with a 10-second resolution. That sum operation requires 12 data points
per time series (60s + 60s = 120s; 120s/10s resolution = 12 data points). If the
query requests 20,000 time series, the number of data points is 240,000 (20,000 time series * 12 data points per series for the 2 minute window).
Dashboard queries request more data points because they use longer ranges. If the
previous example query is a dashboard query and the dashboard window is set to the
past one hour, the data points retrieved are 60 minutes / 2 minute sum interval = 30 intervals, 30 * 240,000 = 7,200,000 data points.
Individual queries requesting more than the allowable limits will time out.
Query resource balancing
Chronosphere tracks the number of concurrent queries received, the scale of each query, and the unique users for each query. Chronosphere makes an effort to fairly balance the available query resources between large and small queries, and also between unique users. If there are many concurrent queries, and each has relatively high scale, some queries might need to complete in stages, and must wait (be throttled) to allow queries from other unique users to make use of the available resources. The more unique users, the more balanced the system is in enabling different queries to complete.
Query timeouts
Even with balancing measures in place, if there are insufficient resources for a query to complete within a specified time period, the query will time out. Chronosphere displays an error message indicating the query timed out.
If a query times out, try these methods to resolve the issue:
- Modify the query syntax to retrieve less data per query. For example, try to shorten the time range.
- Use shaping rules such as aggregation rules to downsample or roll up unnecessary labels, and then modify the query to retrieve aggregated data points instead of the raw data points.