Overview

Chronosphere architecture

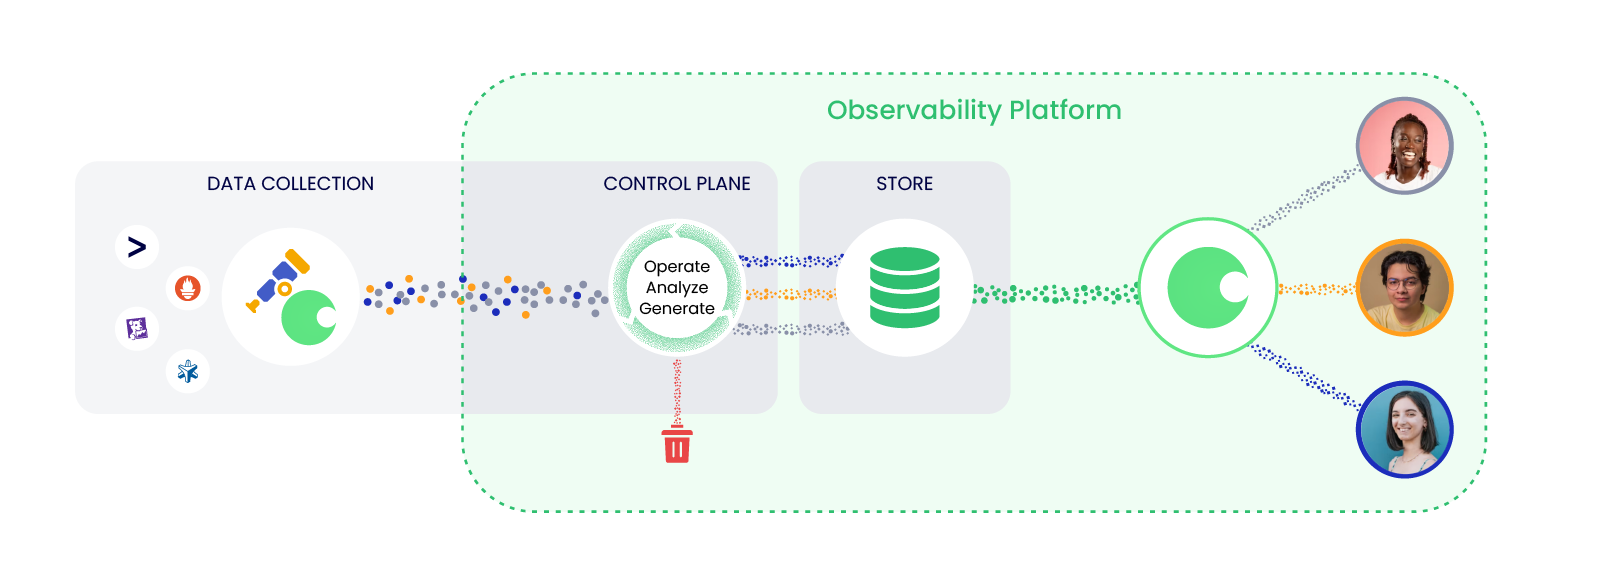
This page contains an overview of the Chronosphere architecture and the primary processes for interacting with the app.

Ingest

Before you observe anything, you need to get your data into Chronosphere. Instrumentation engineers can use the Chronosphere Collector or the OpenTelemetry Collector to discover and scrape endpoints for metrics data, and receive trace data from your app. Scraping metric endpoints is the preferred method of ingesting metrics to the Collector, but you can also ingest additional metric formats.

Authenticate and organize

To start using Chronosphere, sign in with your user account to authenticate. Within the app, user and service accounts provide access to Chronosphere resources that help you observe and act on relevant data. You can create resources with:

Chronosphere organizes resources into teams. A team defines how your organization grants permissions for sensitive management and administrative operations to accounts, including user accounts and service accounts. You can use teams with collections or services to organize resources by their related services or contexts, and provide the people responsible for them fast access to their most relevant resources.

Analyze

Dashboards help you understand and explore your data. With dashboards, you can create, organize, and manage visualizations of query results that your team can use to customize, filter, and focus. On-call engineers can use this information to identify and act on trends, correlate changes in data to incidents, and monitor real-time statuses.

Investigate

Write queries in PromQL and Graphite query languages to explore metrics, populate dashboards with visualizations, and define monitor alerts.

View incoming metrics in real time grouped by their label and relative frequency to:

  • Understand how often your applications emit metrics.
  • Troubleshoot spikes in ingest rates.
  • Ensure the Collector is aware of particular metrics.

You can also determine which metrics your teams find most useful, or which metrics you might consider consolidating.

Alert

Configure alerts to generate notifications, whether it's about your system or about your use of Chronosphere itself. Chronosphere lets you create monitors to query time series, and optionally group results into signals. When a time series meets a condition, an alert triggers that sends a notification. In addition to monitors and alerts, you can query metrics for any triggered series.

Identify

When an alert triggers, you need to identify the root cause of the problem. On-call engineers can use Chronosphere's distributed tracing tools to map and analyze requests as they flow through your system to identify issues related to app latency and diagnose errors. You can also use change events to create a comprehensive view of all changes in your environment. Each change event describes a change within your environment or Chronosphere app at a specific time. Filter change events to understand what changes occurred prior to the onset of an issue. This ability to identify and isolate change events helps remediate issues faster and minimize downstream impacts.

Refine

Shape and transform data to control costs and improve performance. Systems engineers can use the Chronosphere Control Plane to reduce the amount of data retained in your environment over time. Downsample to reduce unneeded data, and focus on important metrics. Create aggregation rules to drop data before it reaches Chronosphere, or aggregate and rewrite data into more manageable and usable statistics. You can create new aggregation rules to preview the impact of a rule on your overall system to prevent breaking changes and test rules before you deploy them. You can also view all of the rules you created in a centralized location to help with data governance.