If you modify a Collector manifest, you must
update it in the cluster and restart the Collector.
Recommended optimizations
The following configurations are recommended for use with the Collector.Enable ingestion buffering
The Collector can retry a subset of metric upload failures (explicitly excludes rate-limited uploads and malformed metrics). To configure ingestion buffering, create a writable directory and pass it to the Collector to store this data.WRITE_DIRECTORY with the writable directory the Collector can use for
ingestion buffering. With Kubernetes, you can use an
emptyDir volume
mount.
You can disable ingestion buffering for individual types of metrics. For example, to
disable ingestion buffer retries for Carbon metrics, add a push.carbon YAML
collection to the Collector configuration file and define ingestion buffering for
Carbon metrics:
Configure connection pooling
Connection pooling is enabled by default with a pool size of
1.Enable staleness markers
When a scrape target disappears or doesn’t return a sample for a time series that was present in a previous scrape, queries return the last value. After five minutes, queries return no value, which means queries might return out-of-date data. By enabling staleness markers, the Collector can hint to the database that a time series has gone stale, and exclude it from query results until it reappears. A staleness marker gets published when the target disappears or doesn’t return a sample. Staleness markers are disabled by default in the Collector configuration. There is a memory cost to enabling staleness markers. The memory increase is dependent on the time series scraped and their labels. For example, if the Collector is scraping 500 time series per second, memory usage increases by about 10%. If it’s scraping 8,000 time series per second, memory usage increases by about 100%. If the Collector has self-scraping enabled, submit the following query with Metrics Explorer to review the scraped time series:Additional configurations
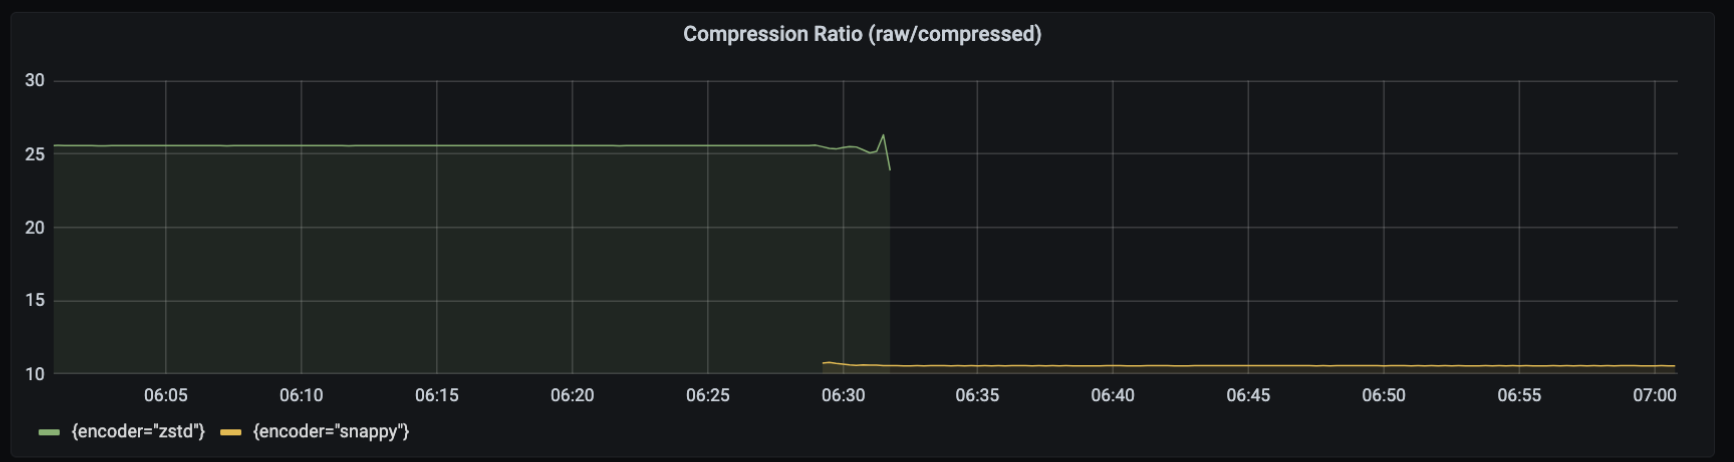
The following configurations are available for your use, as needed.Modify the default compression algorithm
The Collector uses Zstandard (zstd) as the default compression algorithm instead of snappy. The zstd
algorithm can greatly reduce network egress costs, which can reduce the data flowing
out of your network by up to 60% compared to snappy. On average, zstd requires
about 15% more memory than snappy, but offers a compression ratio that’s 2.5 times
greater.
By default, zstd compression concurrency is capped at 1, and all requests must synchronize
access. This limits the memory overhead and CPU processing required for compression.
This can also reduce throughput, although the reduction is limited. If your Collector
encounters processing bottlenecks, you can increase the concurrency value:
level setting, which supports a
range of values ["fastest", "default", "better", "best"] that provide increasing orders
of compression. The Collector defaults to default, which corresponds to Level 3
zstd compression. best strives for the best compression regardless of CPU cost, and
better typically increases the CPU cost by 2-3x. The 2.5x improvement was achieved with
level: default compression and concurrency: 1.
zstd instead of
snappy as the default compression algorithm. Although snappy provides 10 times
(10x) the amount of compression, zstd provides roughly twenty-five times (25x)
compression.
The compression savings realized in your environment greatly depends on the format of
your data. For example, the Collector can achieve higher compression with Prometheus
data, but each payload contains more data than StatsD.
snappy:
Implement environment variables
Environment variable expansion is a powerful concept when defining a Collector configuration. Expansions use the syntax${ENVIRONMENT_VARIABLE:"VALUE"}, which you
can use anywhere to define per-environment configurations dynamically.
For example, the Collector manifests provided in the
Kubernetes installation page include
an environment variable named KUBERNETES_CLUSTER_NAME that refers to the Kubernetes
namespace. You can define a value for this variable in your Collector manifest under
the spec.template.spec.containers.env YAML collection:
YOUR_CLUSTER_NAME with the name of your Kubernetes cluster.
Refer to the
Go Expand documentation for more
information about environment variable expansion.
Environment variable expansions and
Prometheus relabel rule regular expression capture group references can use the same syntax.
For example,
${1} is valid in both contexts.If your relabel configuration uses Prometheus relabel rule regular expression capture
group references, and they are in the ${1} format, escape the syntax by adding an
extra $ character to the expression such as $${1}.Define the listenAddress
The listenAddress is the address that the Collector serves requests on. It supports
the /metrics endpoint and the
import endpoints
if enabled. You can also configure the listenAddress by using the environment
variable LISTEN_ADDRESS.
The default value is 0.0.0.0:3030.
Set the logging level
You can control the information that the Collector emits by setting a logging level in the configuration file. To set a logging level, add the following YAML collection to your configuration:LEVEL with one of the following values. Use the info logging level for
general use.
Temporarily change the Collector logging level
The Collector exposes an HTTP endpoint available at thelistenAddress that
temporarily changes the logging level of the Collector.
The /set_log_level endpoint accepts a JSON body with parameters.
The following request sets the logging level to debug for a duration of 90 seconds:
log_level: Required. Defines the logging level.duration: Optional: Defines the duration to temporarily set the logging level for, in seconds. Default:60.
If you send a new request before a previous request’s duration has expired, the
previous request is overridden with the latest request’s parameters.
Add global labels
You can add global or default labels using:Labels from a configuration list
If you’re using either Kubernetes or Prometheus discovery, you can add default labels as key/value pairs under thelabels.defaults YAML collection:
KUBERNETES_CLUSTER_NAME
environment variable as a default label under the
labels.defaults.tenant_k8s_cluster YAML collection:
labels YAML collection. For example, the following configuration adds rack and
host to every metric:
Labels from an external file
You can define labels in an external JSON file in thelabels.file YAML collection:
labels.json JSON file:
Labels from both a configuration list and an external file
If you specify labels in both the configuration and an external file, the Collector uses the combined list of default labels, if there are no duplicated keys defined with both methods. To specify default labels in both input sources:- Add key/value pairs under the
label.defaultsYAML collection. - Specify an external JSON file in the
labels.fileYAML collection.
labels.json JSON file:
Configure runtime memory limits
The Collector sets a runtime memory limit of 85% of the container (process cgroup) memory quota under Linux, allowing automatic tuning outside of Kubernetes installations. You can customize these limits by configuring settings in theperformance section
of the Collector configuration.
Configure metrics batching
Requires Chronosphere Collector version 0.114.0 or later.The Collector batches metrics across requests to improve efficiency when sending metrics to Observability Platform. For example, the Collector sends a batch of metrics scraped from multiple scrape jobs in a single request to Chronosphere’s metrics ingestion endpoint, rather than creating separate requests to send metrics from each scrape job. The Collector similarly batches metrics from push protocols, such as Pushgateway and DogStatsD. The Collector batches metrics on a per-protocol basis, with separate batches for Prometheus scraped metrics, Pushgateway, DogStatsD, and other protocols. The
requestBatching settings, configured in the backend YAML collection, apply
globally to each independent protocol queue.