Anatomy of a Datadog query
The following example illustrates the structure of a Datadog query. Other queries might be in a different order:- Evaluation window:
avg(last_1d) - Space aggregator:
avg - Function:
count_nonzero - Metric name:
uptime - Filters/scope:
app:shopist - Grouping:
host - Type converter:
as_rate() - Functions:
rollup(avg,3600) - Operators:
<2
Query syntax and modes
Querying DogStatsD metrics in Chronosphere are based on the different modes set in the Collector. Metrics storage in the backend depends on themode configured in the dogstatsd
section of the push configuration in the Collector.
The query syntax is slightly different for each mode.
-
regularThe DogStatsDMETRIC_NAMEmaps to the Prometheus__name__label, replacing all non-alphanumeric and non-dot characters with underscores. Dots convert to an underscore (_). Any labels defined on the metric remain unchanged and append to the list of labels. Refer to Prometheus naming recommendations for specific information. -
graphiteThe Prometheus__name__label gets a constantstatname and the DogStatsDMETRIC_NAMEassigns to a Prometheus label set in the configurationnamelabelname(by defaultname). -
graphite_expandedThe expanded Graphite mode is the same asgraphitemode, except in addition to storing everything in thenamelabelnamelabel, theMETRIC_NAMEseparates on dot (.) and stores each part in a separate label. For example,t0,t1, andt2.
Querying best practices
Forgraphite_expanded metrics, it’s best to start your query with stat, and then
search for either t0 or the defined labels using autocomplete. By starting with
stat, your search scope focuses on the DogStatsD metrics, which improves query performance.
For example, using the previous metric (users.online:2|c|#country:france),
you can start your query with stat, add t0 and using autocomplete, and search for
users. Then, search for t1 and so on.
Metric types and querying
All metrics convert to Prometheus metric types before storage in Chronosphere. Most metric types are the same across DogStatsD and Prometheus with the exception of counters. Counters in Prometheus are running counters, which means they always increase or remain constant, and never decrease. DogStatsD counters areDELTA counters.
When querying counters in Chronosphere, apply a
rate () function.
Querying Prometheus counters
In Prometheus, counters increase monotonically and must be wrapped in either a rate/increase function. Chronosphere conversion tooling attempts to fetch the metric type from Datadog. In this case of network issues or the metric not existing on Datadog side, it falls back to doing a substring match (ending in_total, _count,
and so on). As an example, gke_event_reception_client_track_event doesn’t end in a
typical counter-like suffix so Chronosphere assumes that it’s a gauge if the
metric type fetch fails.
The converted query might look like this:
Convert cumulative histogram queries
To correctly query histograms in Prometheus, you need to know the correct patterns. Unlike Datadog distributions, Prometheus histograms the_bucket suffix.
When doing a sum by condition, you must include
le.Query for quantiles
If your original Datadog query is:Query for average
If your original Datadog query is this:Min and max
Convert histogrammin and max by taking the histogram_quantile(0, ...) and
histogram_quantile(1, ...) respectively.
Convert exponential histogram queries
It’s important to know the pattern for correctly querying cumulative histograms in Prometheus coming from querying for distributions in Datadog.Query for quantiles
If your original Datadog query is this:Query for average
Exponential histograms have some special functions to calculateavg, min, max,
and count. These functions are histogram_avg(), and histogram_count().
If your original Datadog query is this:
Min and Max
Histogrammin and max can be converted by taking the histogram_quantile(0, ...)
and histogram_quantile(1, ...), respectively.
Advanced: Take the 1 Hour Average of the p99 of a Histogram
Any PromQL query can be wrapped in any<aggregation>_over_time() function. To do
so, you must leverage PromQL subquery syntax. The generic format is:
<aggregation>_over_time((<orig_query>)[1h:]).
Without the subquery syntax [1h:], you will see an error like parse error: ranges only allowed for vector selectors. In PromQL, the [1h:] subquery syntax is
necessary when wrapping a query with an <aggregation>_over_time() function because
these functions operate on time series data over a range of time.
The [1h:] specifies a time range (1h) for the subquery and a default resolution
(:) for how often to evaluate the data points within that range. This creates a set
of data points over the specified time range that the <aggregation>_over_time()
function can process.
If your original Datadog query is this:
Query differences between Datadog and Chronosphere
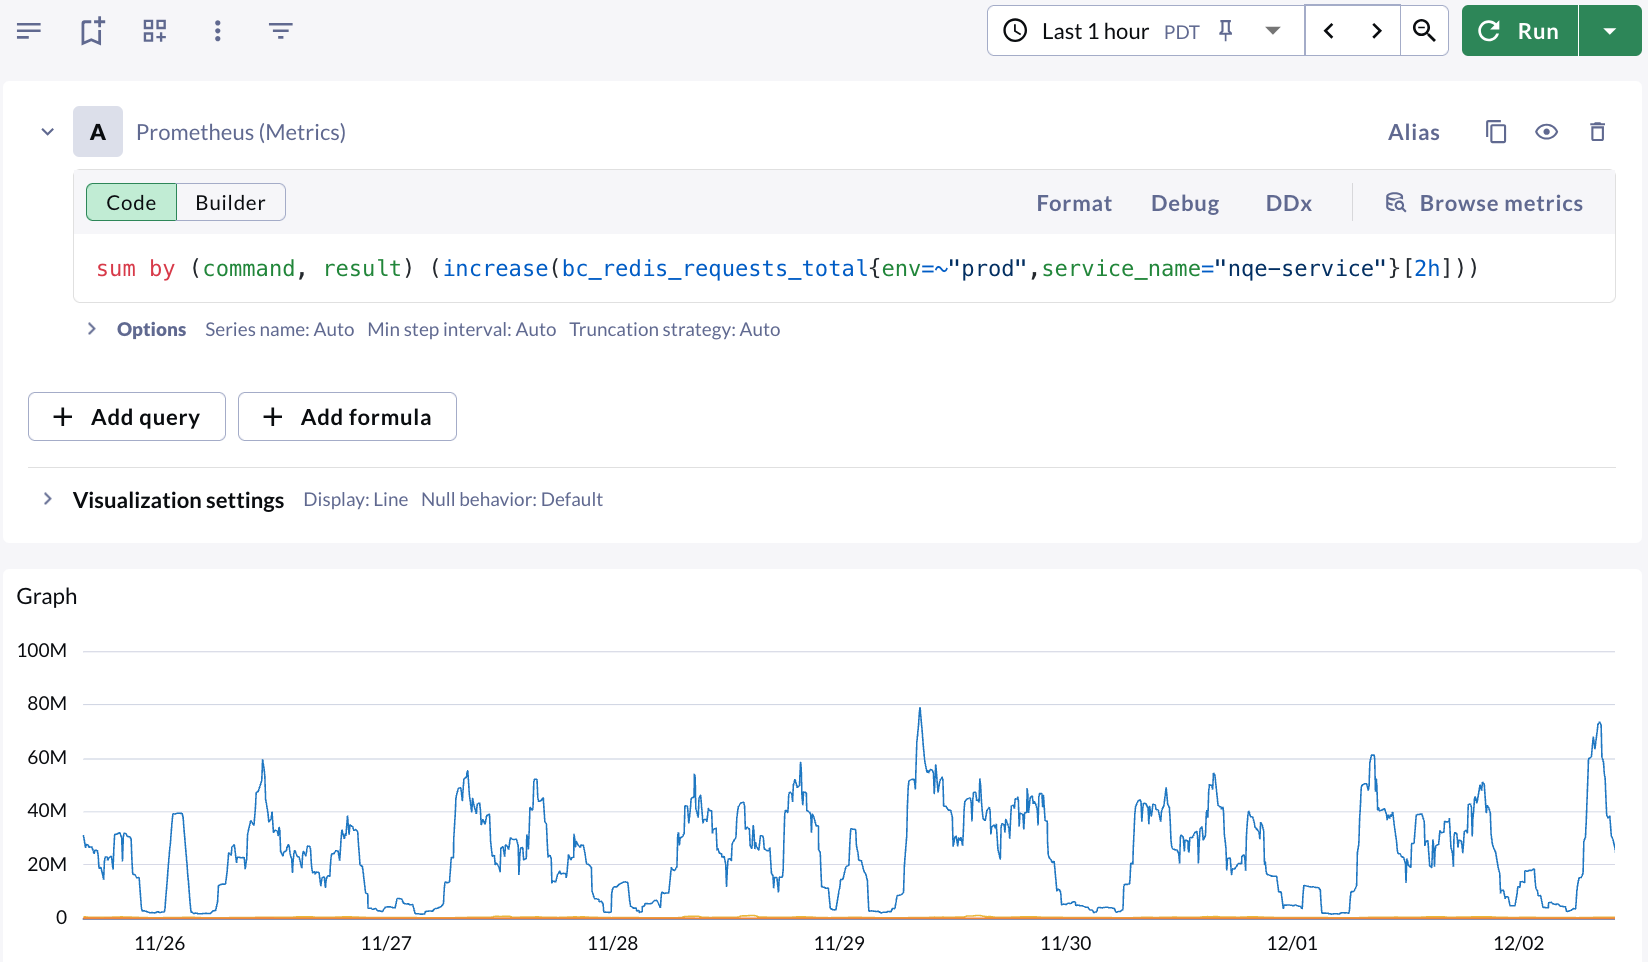
There are syntax differences between Chronosphere and Datadog queries. When you see differences in your data between the platforms, the following sections can help you determine the cause.Differences in interval
If there are differences in the data being displayed in panels between Datadog and Chronosphere, review the time windows being used to see if they’re different. Datadog can default to displaying a 30 minute time window for deltas, while Chronosphere defaults to 10 minutes. Adjust the query to use the same time window andmin step
interval to validate the data. The following images show examples of these
differences:
Datadog displaying 2-hour deltas for the past 7 days:

Set the Min step
Prometheus, like Datadog, defaults to using a step size which is a function of the user interface’s window size and query time window. Although you might want a line chart showing trends over time, a bar chart using sum the of values in the chart displays values higher than the actual values. Chronosphere recommends setting theMin step option
equal to the interval used in the query.
In dashboards, you can use the $interval variable in both places.
Handle label mismatch in division using group_left and ignoring
Vector matching will fail when doing arithmetic on time series with different label
sets. In this example, division fails when grouping by label_A and label_B in the
numerator, but only label_A in the denominator.
Sum multiple sparse Series
Unlike Datadog, PromQL doesn’t have behavior toinfer null as 0. This means when
you try summing together multiple sparse time series, the result will be null if any
individual time series is null. For example, take the following query:
requests.failed only ever comes intermittently, the resulting addition would
only produce a value when both requests.succeeded and requests.failed return
values simultaneously. To solve this problem, Chronosphere recommends concatenating
the metrics together on __name_:
Complex Boolean logic in filters
Datadog has support for complex Boolean conditionals in label filters. Take the following query:NOT error:404: Select all metrics except those with error:404.AND: Both conditions need to be satisfied.NOT (namespace:my.namespace AND error:503): Select all metrics except those withnamespace:my.namespaceanderror:503together.
my_metric{error!="404"} filters out metrics where error is 404 unless PromQL is used to exclude a subset of the data that matches certain labels from the main set.
my_metric{namespace="my.namespace", error="503"} defines the subset to exclude, which is those with namespace:my.namespace and error:503.
This conversion ensures the correct logical interpretation of the original Datadog query.