Kubernetes Collector installation to retrieve metrics
The recommended way to install the Chronosphere Collector to retrieve metrics data is with a Kubernetes DaemonSet scraping endpoints, using either annotations or ServiceMonitors. This configuration ensures that if a Collector pod restarts or terminates, only the metrics in that node aren't scraped, and all other nodes remain unaffected.
The following steps align with this method of installing the Collector.
You can also install the Collector with Kubernetes as a Deployment or as a sidecar.
The following steps assume that the applications running in the Kubernetes cluster expose Prometheus metrics. To ingest other metric types such as StatsD, refer to Ingest additional metrics.
To install the Collector:
- Create an API token.
- Define the Collector manifest.
- Create a Kubernetes secret.
- Install the Collector.
- Verify the Collector.
Create an API token
To interact with the Collector, you must
create a service account.
Chronosphere recommends creating a restricted service account with a write-only
scope. Use the generated API token in your Kubernetes Secret to authenticate
with the Collector.
Store your API token in a secure location. If you lose your token, you must create a new service account.
Define the Collector manifest
-
Download the example manifest (opens in a new tab).
-
Locate the
spec.template.spec.containers.imageYAML collection and changevVERSION_NUMBERto the version of the Collector you want to install. For example,v0.100.1:spec: template: spec: containers: - image: gcr.io/chronosphereio/chronocollector:vVERSION_NUMBERChronosphere supports Chronosphere Collector versions for a year from release. You can find a full list of versions and release dates in the Collector release notes located in the Chronosphere Observability Platform. To view the release notes, in the navigation menu select Help > Release notes, and then click the Collector tab.
-
Modify any configuration values in the
ConfigMapbased on your needs. Refer to the Collector configuration for details on configuration options.
Create a Kubernetes secret
Create a Kubernetes Secret that includes the API token from your service account,
plus a custom domain address.
-
Add
base64encoding to your domain name and API token:echo -n "ADDRESS" | base64 echo -n "API_TOKEN" | base64Replace the following:
ADDRESS: your company name prefixed to your Chronosphere Observability Plaftorm instance that ends in.chronosphere.io:443. For example,MY_COMPANY.chronosphere.io:443.API_TOKEN: the API token generated from your service account.
-
Copy the values that output to your terminal, which you add as part of your Kubernetes
Secretin the next step. -
In your
chronocollector.yamlfile, locate the following YAML collection and replace values foraddressandapi-tokenwith the encoded values that you copied from your terminal.apiVersion: v1 data: address: ENCODED_ADDRESS api-token: ENCODED_API_TOKEN kind: Secret metadata: labels: app: chronocollector name: chronosphere-secret namespace: default type: OpaqueAnother option is to add the
ADDRESSandAPI_TOKENdirectly to the Kubernetes cluster usingkubectl:kubectl create secret generic chronosphere-secret \ --from-literal=api-token=API_TOKEN \ --from-literal=address=ADDRESS -
Save and close your
chronocollector.yamlfile.
Now you're ready to install the Collector.
Install the Collector
To install the Collector, apply the chronocollector.yaml manifest that you
configured. When using a
DaemonSet (opens in a new tab),
you must install the Collector on each node in a cluster.
Installing the Collector grants permissions to read metadata about pods scheduled on
the local node. Review your chronocollector.yaml manifest carefully before applying
it.
-
Apply the manifest.
kubectl apply -f path/to/chronocollector.yaml -
Confirm that the
DaemonSetis up and running, and view the logs of the pod:kubectl get pods NAME READY STATUS RESTARTS AGE chronocollector-POD_NAME 1/1 Running 0 1m -
View the pod logs to ensure there are no errors:
kubectl logs chronocollector-POD_NAME
...
Replace
POD_NAMEwith the name of the Kubernetes pod where your Collector instance is running.
Verify the Collector
After installing the Collector, verify it's sending metrics to your Observability Platform tenant:
-
Open Observability Plaform and in the navigation menu select Explorers > Metrics Explorer.
-
Enter the following query in the query field.
count(chronocollector_jobs) by (instance) -
Click Run query.
The name of your Collector instance returned from the
kubectl logscommand displays in the table of metrics:Time Instance 2023-02-03 10:56:04 default/chronocollector-POD_NAME
For other methods of verifying that the Collector is running, refer to verify and monitor the Collector.
Install the Collector using a Deployment
If you use Prometheus service discovery, deploy the Collector as a standalone Deployment. This implementation avoids every Collector duplicating scrapes to all endpoints defined in the Prometheus service discovery configuration.
Only run the Collector as a Deployment (opens in a new tab) if you're using configuration-based Prometheus service discovery, or where specified in the service discovery documentation. Otherwise, deploy the Collector as a DaemonSet.
The instructions for deploying the Collector as a Deployment are the same as for a DaemonSet, except you use this manifest (opens in a new tab).
Install the Collector as a sidecar
Some environments (like AWS Fargate) restrict users from deploying an app as a
DaemonSet and require deploying the Collector as a sidecar alongside other
containers. You can also use a sidecar configuration for more control over resource
utilization for particularly high cardinality scrape targets.
If your app is already running as a container in a Pod, you can add the Collector as
another container in the same Pod. The instructions for deploying the Collector as a
sidecar are the same as for a DaemonSet, except you use
this manifest (opens in a new tab)
and add the Collector as another container to the spec.template.spec.containers
block of the manifest, along with any other Kubernetes resources your app requires.
Configure service discovery
After configuring and installing the Collector, configure Kubernetes annotations so that the Collector can start scraping the Pods in your Kubernetes cluster.
If you installed the Collector as a Deployment or as a sidecar service,
configure service discovery
using ServiceMonitors or Prometheus service discovery.
Modify Collector resource usage
After deploying the Collector, you can modify resource usage depending on various inputs, including, but not limited to:
- Amount of scraped metrics
- Scrape interval of each target
- Number of metric labels
- Total length of the label strings
Because the work of the Collector is I/O bound, Chronosphere recommends running the Collector with one Kubernetes CPU unit (opens in a new tab) or its equivalent.
To simplify the process of predicting memory usage, make an initial estimation based on the number of metrics scraped every second by your Collector instance. The following table lists the recommended memory limits for a Collector instance, with its default settings based on observed usage:
This information is both a starting point and an upper limit. Tune your Collectors after their deployments, based on practical usage.
| Metrics/Second | Recommended memory |
|---|---|
| 0k to 10k | 500 MB |
| 10k to 20k | 800 MB |
| 20k to 30k | 1 GB |
| Greater than 30k | 1 GB and 200 MB per additional 5k metrics/sec |
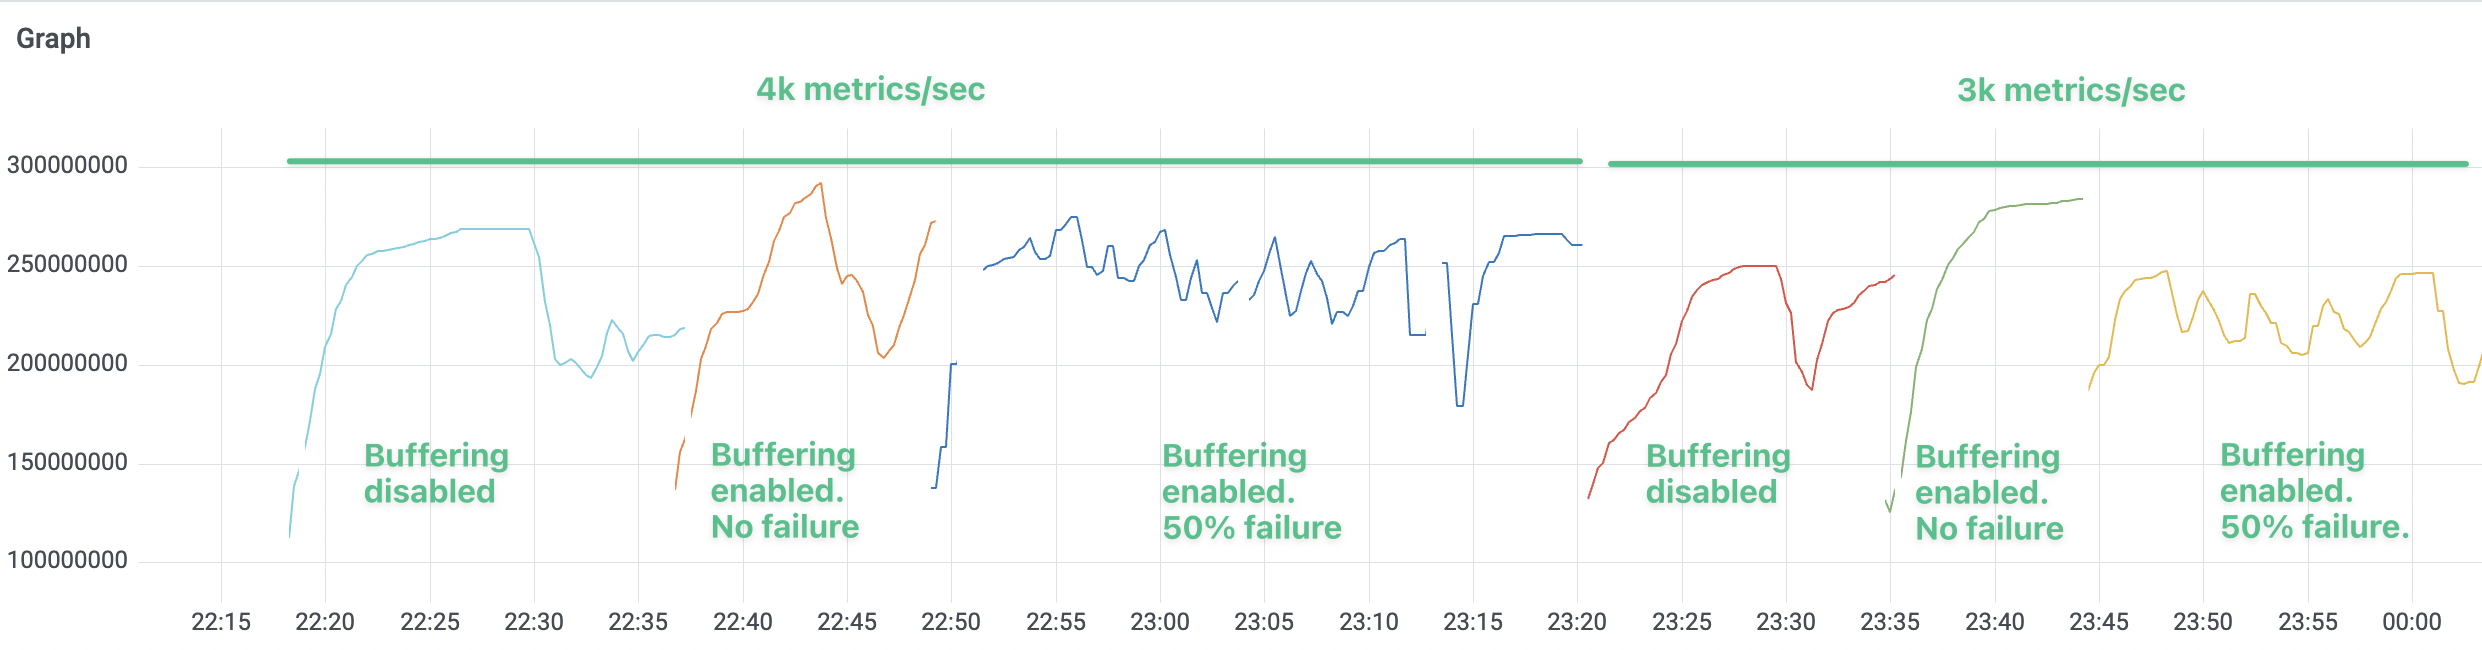
Ingestion buffering
Enabling ingestion buffering doesn't have any substantial impact on memory usage.
The following graph displays the memory usage of a Collector instance handling different input data volume (4k and 3k metrics per second, respectively). The memory usage doesn't change significantly after enabling the buffering feature or increasing the failure rate from 0% to 50%.