Navigate the Observability Platform interface
The Chronosphere Observability Platform user interface guides you to the resources you need.
Personal home page
After you sign in, Observability Platform displays your personal home page. The Recent Dashboards and Recent Monitors sections link to recently viewed resources.
To view a panel of all collections, in the navigation menu exit the Admin menu (if needed, click Exit Admin) and select Collections. If your user account belongs to a team, collections that belong to your team appear first in the panel. Clicking a team or collection opens its home page.
Team and collection home pages
Teams and collections have their own home pages populated with links to associated resources, and also customizable links and descriptions. For details, see Team and collection home pages.
Search
Observability Platform provides a global search bar on every page that supports searching for teams, collections, dashboards, monitors, services, and SLOs by name. To search, click the search bar or use the keyboard shortcut Control+K (Command+K on macOS) to focus on the bar, and then begin typing. Search results will appear as you type.
By default, search results include all supported resource types. To toggle a resource type’s visibility in the results, click its selector at the top of the results list.
The icons in the resource type filters correspond to the icons displayed next to each result and identify each result’s type. Resources in the results that belong to a team or collection also list them beneath the result’s name.
Your account
The interface represents your signed-in account by your first initial in a circle. Click your account to open a panel to:
- Select your UI theme.
- Select the Time zone your account uses to display data.
- Choose your Clock display preference: 12-hour or 24-hour.
- Open the My Account page, which contains details about your account and your personal access tokens.
- Sign Out of Observability Platform.
- Confirm your signed-in account’s email address and the Observability Platform version number.
Help and documentation
Click Help to open a panel containing links to these resources:
- Chronosphere University (opens in a new tab) training
- Product documentation
- Support portal (opens in a new tab)
- Provide feedback on Observability Platform
- Release notes for Observability Platform, Chronosphere Collector, Chronoctl, and the Chronosphere Terraform provider.
- The Chronosphere Privacy Notice (opens in a new tab)
Feature navigation
The navigation menu contains links to each of its toolsets and functions:
All users:
- System Overview links to tools to explore services and service level objectives (SLOs).
- Collections opens a panel with links to home pages for each team and collection, and a link to your personal home page.
- Dashboards opens the list of all dashboards.
- Alerts links to tools related to monitors, alerts, and notifications.
- Explorers links to tools to explore metrics, traces, logs, and change events.
Administrators only:
- License Overview opens a page with details about your license usage.
- Analyzers links to metric and query analysis tools.
- Control links to metric and trace management tools.
- Platform links to administrative tools and maintenance views.
Header navigation
Dashboards, service pages, and SLOs in Observability Platform have a header that displays team ownership and the collection or service that owns the displayed resource. The header also enables searching for other resources owned by the same team or collection.
-
In the navigation menu, select either Dashboards, Services, or SLOs.
-
Click a dashboard, service, or SLO from the table.
-
Click the dashboard or service name to display the header overview.
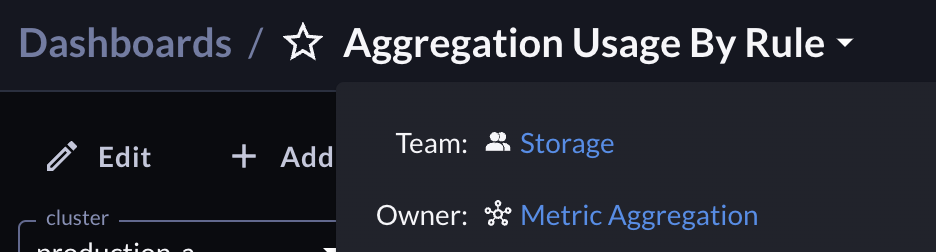
You can click the team, service, or collection name to go to its overview page.
Keyboard shortcuts
Many pages in Observability Platform include keyboard shortcuts. Press Control+/ (Command+/ on macOS) to display the shortcuts for a page. Not all pages include shortcuts.
Mobile-friendly pages
Some pages in Observability Platform have been optimized for use on cell phones and other mobile devices. Mobile-friendly pages include Monitors, Dashboards, Services, SLOs, Collections, and Teams.
Chips
Observability Platform uses chips (opens in a new tab) in the web app. Chips are generally used as filters to narrow down the scope of searches or queries. Pinned scopes and search are two examples of pages using chips.
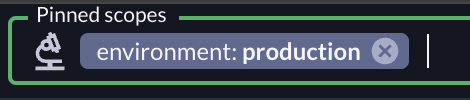
If a chip has a close icon, you can click the icon to remove the chip. Chips without a close icon are pinned scopes that can be deactivated or reactivated by clicking the chip.
Documentation
Pages, dialog boxes, and drawers in Observability Platform contain links to relevant documentation. Click the open book icon to navigate to the documentation page.
Release notes
To view product release notes for Observability Platform, Chronosphere Collector, Chronoctl, or the Chronosphere Terraform provider, sign in to Observability Platform. In the navigation menu select Help > Release Notes.