Pinned scopes
Pinned scopes aren’t available for all pages. Users can’t create pinned scopes at this time, but you can configure a scope. Contact Chronosphere Support to have scopes created for you.
Pinned scopes define a set of consistent criteria for users to select a subset of data. After configuration, pinned scopes appear on several pages in Chronosphere Observability Platform.
Filter using a pinned scope
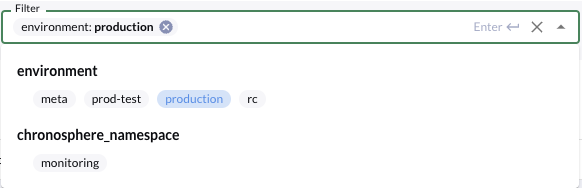
Click the Pin scope box in a supported page to display the configured filters. Click any filter to select it.
A pinned scope can exclude all data from a page, or sections of a page. For monitors on a service page, if no monitors match the selected filter, Observability Platform displays all monitors instead.
You can use pinned scopes to group signals inside a monitor in a service, to reduce alerts.
Modify a pinned scope in a query
When you activate a pinned scope on a page with user-generated queries, the chip for the pinned scope displays with the query.
Click the pinned scope to activate or deactivate it.
To view the scoped query, click the telescope icon. A dialog box displays both the current pinned scopes modifying the query and the full scoped query. Click Copy scoped query to copy the full query to your clipboard.
For example, if you’re using the pinned scope environment:production, and query
for chronocollector_build_information, the dialog would display a message similar to:
This query is being modified by the currently pinned scope

environment: production
The scoped query is:

chronocollector_build_information{environment=~"(|production)"}
You can copy the full query if necessary, and modify it.
Scope conflicts
Queries with a conflict display with a yellow dot on the telescope icon. A conflict occurs if the queries have a label matcher that matches a pinned scope. When a scope conflict occurs, your query might retrieve less data than expected.
To correct a conflict:
- View the query.
- Click the conflicting matcher. Conflicting matchers use a warning icon and are highlighted.
- The Resolve conflict window lists the conflicting matchers, and lets you
correct conflicts by taking one of the following actions:
- Remove conflicting matchers: Recommended. This field prepopulates with the conflicting matchers. Leave as is, or delete a chip to remove some matchers. The label matchers list updates based on the matchers to be removed.
- Disable pinned scope: Disable the pinned scope for this query or for the page.
- Click Confirm to continue or Do nothing to return to the previous page.