Chronosphere Collector optimizations
The following configurations provide different optimizations for the Chronosphere Collector. Although their use isn’t required, some of these configurations are recommended, and all of them can optimize the Collector in different ways, depending on your needs.
These configurations apply to running the Collector with either Kubernetes or Prometheus.
If you modify a Collector manifest, you must update it in the cluster and restart the Collector.
Recommended optimizations
The following configurations are recommended for use with the Collector.
Enable ingestion buffering
The Collector can retry a subset of metric upload failures (explicitly excludes rate-limited uploads and malformed metrics).
To configure ingestion buffering, create a writable directory and pass it to the Collector to store this data.
ingestionBuffering:
  retry:
    enabled: true
    directory: /path/to/WRITE_DIRECTORY
    # How long individual metric uploads should be retried before being considered permanently failed
    # Values greater than 90 seconds may lead to unexpected behavior and are not supported
    defaultTTLInSeconds: 90
    # The Collector will use strictly less than this amount of disk space.
    maxBufferSizeMB: 1024
Replace WRITE_DIRECTORY with the writable directory the Collector can use for
ingestion buffering. With Kubernetes, you can use an
emptyDir (opens in a new tab) volume
mount.
Disabling ingestion buffering requires Chronosphere Collector version 0.81.0 or later.
You can disable ingestion buffering for individual types of metrics. For example, to
disable ingestion buffer retries for Carbon metrics, add a push.carbon YAML
collection to the Collector configuration file and define ingestion buffering for
Carbon metrics:
push:
  carbon:
    retry:
      disabled: true
      # You can also adjust the TTL for this type of metric here
      # ttlInSeconds: 30
Configure connection pooling
Requires Chronosphere Collector version 0.82.0 or later.
Chronosphere Collector version 0.89 and later enables connection pooling by default. The default connection pool size as of Chronosphere Collector version 0.106.0 is 1.
A single Collector instance is capable of high throughput. However, if the Collector sends metrics at more than 100 requests per second, increase the number of pooled backend connections to improve overall throughput in the client.
If you enable self-scraping, you can submit the following query with Metrics Explorer to verify the connection pooling setting:
sum by(instance) (rate(chronocollector_gateway_push_latency_count[1m])) > 100To configure connection pooling, add the following YAML collection and define the values appropriately:
backend:
  connectionPooling:
    # Enables connection pooling. By default, this is enabled.
    enabled: true
    # The pool size is tunable with values from [1,8]. If not specified and pooling is enabled, then
    # the default size is 1.
    poolSize: 1
Enable staleness markers
Requires Chronosphere Collector version 0.86.0 or later.
When a scrape target disappears or doesn’t return a sample for a time series that was present in a previous scrape, queries return the last value. After five minutes, queries return no value, which means queries might return out-of-date data.
By enabling staleness markers, the Collector can hint to the database that a time series has gone stale, and exclude it from query results until it reappears. A staleness marker gets published when the target disappears or doesn’t return a sample. Staleness markers are disabled by default in the Collector configuration.
Staleness markers are a best effort optimization.
If a Collector instance restarts on the last scrape before a sample isn’t provided for a time series, a staleness marker isn’t published.
There is a memory cost to enabling staleness markers. The memory increase is dependent on the time series scraped and their labels.
For example, if the Collector is scraping 500 time series per second, memory usage increases by about 10%. If it’s scraping 8,000 time series per second, memory usage increases by about 100%. If the Collector has self-scraping enabled, submit the following query with Metrics Explorer to review the scraped time series:
rate(chronocollector_scrape_sample[5m])To enable staleness markers, add the following YAML collection to your Collector configuration:
scrape:
  enableStalenessMarker: true
Additional configurations
The following configurations are available for your use, as needed.
Modify the default compression algorithm
Chronosphere Collector versions 0.89.0 and later use Zstandard (opens in a new tab)
(zstd) as the default compression algorithm instead of snappy. The zstd
algorithm can greatly reduce network egress costs, which can reduce the data flowing
out of your network by up to 60% compared to snappy. On average, zstd requires
about 15% more memory than snappy, but offers a compression ratio that’s 2.5 times
greater.
By default, zstd compression concurrency is capped at 1, and all requests must synchronize access. This limits the memory overhead and CPU processing required for compression.
This can also reduce throughput, although the reduction is limited. If your Collector encounters processing bottlenecks, you can increase the concurrency value:
backend:
  zstd:
    concurrency: 1
Similarly, you can tune the compression level. With a level setting, which supports a
range of values ["fastest", "default", "better", "best"] that provide increasing orders
of compression. The Collector defaults to default, which corresponds to Level 3
zstd compression. best strives for the best compression regardless of CPU cost, and
better typically increases the CPU cost by 2-3x. The 2.5x improvement was achieved with
level: default compression and concurrency: 1.
backend:
zstd:
concurrency: 1
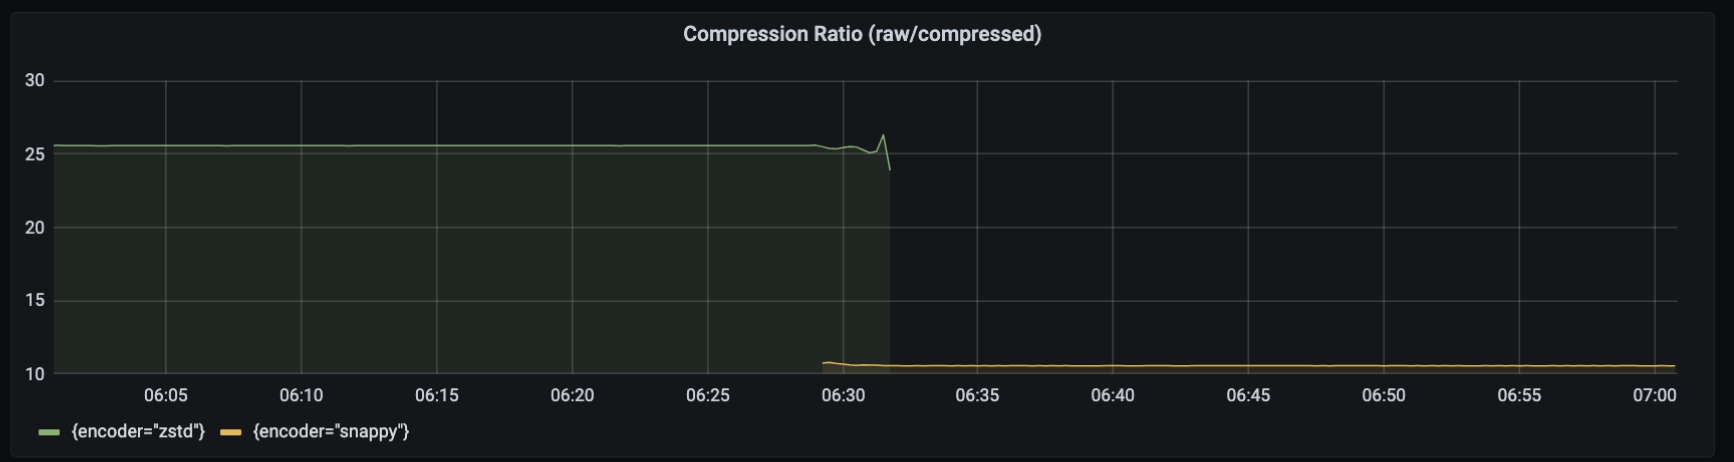
level: "default" # fastest, default, better, and best are acceptable values.The following graph shows the compression difference between using zstd instead of
snappy as the default compression algorithm. Although snappy provides ten times
(10x) the amount of compression, zstd provides roughly twenty-five times (25x)
compression.
The compression savings realized in your environment greatly depends on the format of your data. For example, the Collector can achieve higher compression with Prometheus data, but each payload contains more data than StatsD.
If this tradeoff doesn’t work for your environment, you can modify the Collector
configuration file to instead use snappy:
backend:
  compressionFormat: "snappy"
Implement environment variables
Environment variable expansion is a powerful concept when defining a Collector
configuration. Expansions use the syntax ${ENVIRONMENT_VARIABLE:"VALUE"}, which you
can use anywhere to define per-environment configurations dynamically.
For example, the Collector manifests provided in the
Kubernetes installation page include
an environment variable named KUBERNETES_CLUSTER_NAME that refers to the Kubernetes
namespace. You can define a value for this variable in your Collector manifest under
the spec.template.spec.containers.env YAML collection:
spec:
  template:
    spec:
      containers:
        env:
          - name: KUBERNETES_CLUSTER_NAME
            value: YOUR_CLUSTER_NAME
Replace YOUR_CLUSTER_NAME with the name of your Kubernetes cluster.
Refer to the
Go Expand documentation (opens in a new tab) for more
information about environment variable expansion.
Environment variable expansions and
Prometheus relabel rule (opens in a new tab) regular expression capture group references can use the same syntax.
For example, ${1} is valid in both contexts.
If your relabel configuration uses Prometheus relabel rule regular expression capture
group references, and they are in the ${1} format, escape the syntax by adding an
extra $ character to the expression such as $${1}.
Define the listenAddress
The listenAddress is the address that the Collector serves requests on. It supports
the /metrics endpoint and the
import endpoints
if enabled. You can also configure the listenAddress by using the environment
variable LISTEN_ADDRESS.
The default value is 0.0.0.0:3030.
Set the logging level
You can control the information that the Collector emits by setting a logging level in the configuration file.
To set a logging level, add the following YAML collection to your configuration:
logging:
  level: ${LOGGING_LEVEL:LEVEL}
Replace LEVEL with one of the following values. Use the info logging level for
general use.
| Logging level | Description |
|---|---|
info | Provides general information about state changes, such as when adding a new scrape target. |
debug | Provides additional details about the scrape discovery process. |
warn | Returns information related to potential issues. |
error | Returns error information for debugging purposes. |
panic | Don’t use this logging level. |
Temporarily change the Collector logging level
The Collector exposes an HTTP endpoint available at the listenAddress that
temporarily changes the logging level of the Collector.
The /set_log_level endpoint accepts a JSON body with parameters.
The following request sets the logging level to debug for a duration of 90 seconds:
curl -X PUT http://localhost:3030/set_log_level -d '{"log_level": "debug", "duration": 90}'log_level: Required. Defines the logging level.duration: Optional. Defines the duration to temporarily set the logging level for, in seconds. Default:60.
If you send a new request before a previous request’s duration has expired, the previous request is overridden with the latest request’s parameters.
Add global labels
You can add global or default labels using:
If you define a global label with the same name as the label of an ingested metric, the Collector respects the label for the ingested metric and doesn’t overwrite it.
Labels from a configuration list
If you’re using either Kubernetes or Prometheus discovery, you can add default labels
as key/value pairs under the labels.defaults YAML collection:
labels:
  defaults:
    my_global_label: ${MY_VALUE:""}
    my_second_global_label: ${MY_SECOND_VALUE:""}
If you’re using Kubernetes, you can append a value to each metric sent to
Chronosphere Observability Platform by adding the KUBERNETES_CLUSTER_NAME
environment variable as a default label under the
labels.defaults.tenant_k8s_cluster YAML collection:
labels:
  defaults:
    tenant_k8s_cluster: ${KUBERNETES_CLUSTER_NAME:""}
Refer to the Kubernetes documentation (opens in a new tab) for more information about pod fields you can expose to the Collector within manifest.
For Prometheus discovery, you can add labels to your job configuration using the
labels YAML collection. For example, the following configuration adds rack and
host to every metric:
static_configs:
  - targets: ['0.0.0.0:9100']
    labels:
      host: 'foo'
      rack: 'bar'
Labels from an external file
You can define labels in an external JSON file in the labels.file YAML collection:
labels:
  file: "labels.json"
You then add key/value pairs in the labels.json JSON file:
{
  "default_label_1": "default_val_1",
  "default_label_2": "default_val_2"
}
Labels from both a configuration list and an external file
If you specify labels in both the configuration and an external file, the Collector uses the combined list of default labels, if there are no duplicated keys defined with both methods.
If you define a label key both in the static list in configuration and the external JSON file, the Collector reports an error and fails to start.
To specify default labels in both input sources:
- Add key/value pairs under the
label.defaultsYAML collection. - Specify an external JSON file in the
labels.fileYAML collection.
labels:
  defaults:
    default_label_1: "default_val_1"
    default_label_2: "default_val_2"
  file: "labels.json"
You then add key/value pairs in the labels.json JSON file:
{
  "default_label_3": "default_val_3",
  "default_label_4": "default_val_4"
}
In this example, the Collector uses all four default labels defined.
Configure runtime memory limits
Collector v0.109.0 sets a runtime memory limit of 85% of the container (process cgroup) memory quota under Linux, allowing automatic tuning outside of Kubernetes installations.
You can customize these limits by configuring settings in the performance section
of the Collector configuration.
performance:
  # enforceSoftMemoryLimit enables automatic turning of GOMEMLIMIT from environment
  # (Linux cgroups) limits. Enabled by default.
  enforceSoftMemoryLimit: true
  # reservedMemoryPercent controls how much memory to set aside for non-heap use,
  # if memory quota was autodetected from cgroup limits.
  # Go runtime memory limit will be set to $quota - ($quota * reservedMemoryPercent / 100).
  # For more information, see https://go.dev/doc/gc-guide#Memory_limit
  reservedMemoryPercent: 15
Configure metrics batching
Requires Chronosphere Collector version 0.114.0 or later.
The Collector batches metrics across requests to improve efficiency when sending metrics to Observability Platform. For example, the Collector sends a batch of metrics scraped from multiple scrape jobs in a single request to Chronosphere’s metrics ingestion endpoint, rather than creating separate requests to send metrics from each scrape job. The Collector similarly batches metrics from push protocols, such as Pushgateway and DogStatsD.
The Collector batches metrics on a per-protocol basis, with separate batches for Prometheus scraped metrics, Pushgateway, DogStatsD, and other protocols.
The requestBatching settings, configured in the backend YAML collection, apply
globally to each independent protocol queue.
Don’t change the default settings unless advised to do so by Chronosphere Support. The following example documents these settings but intentionally comments them out.
# backend:
#   requestBatching:
#     disabled: false
#     # maxConcurrentRequests limits the max number of in-flight requests.
#     maxConcurrentRequests: 50
#     # maxBufferSize is a limit in bytes for in-flight data payloads. Requests are
#     # rejected if an amount of bytes larger than this value is already in flight,
#     # similar to `maxConcurrentRequests`.
#     maxBufferSize: 1073741824
#     # batchTimeout sets the maximum delay for requests if the minimum batch threshold
#     # hasn't been reached.
#     batchTimeout: 5s
#     # maxRequestSize is the threshold in bytes that triggers a backend request.
#     maxRequestSize: 131072